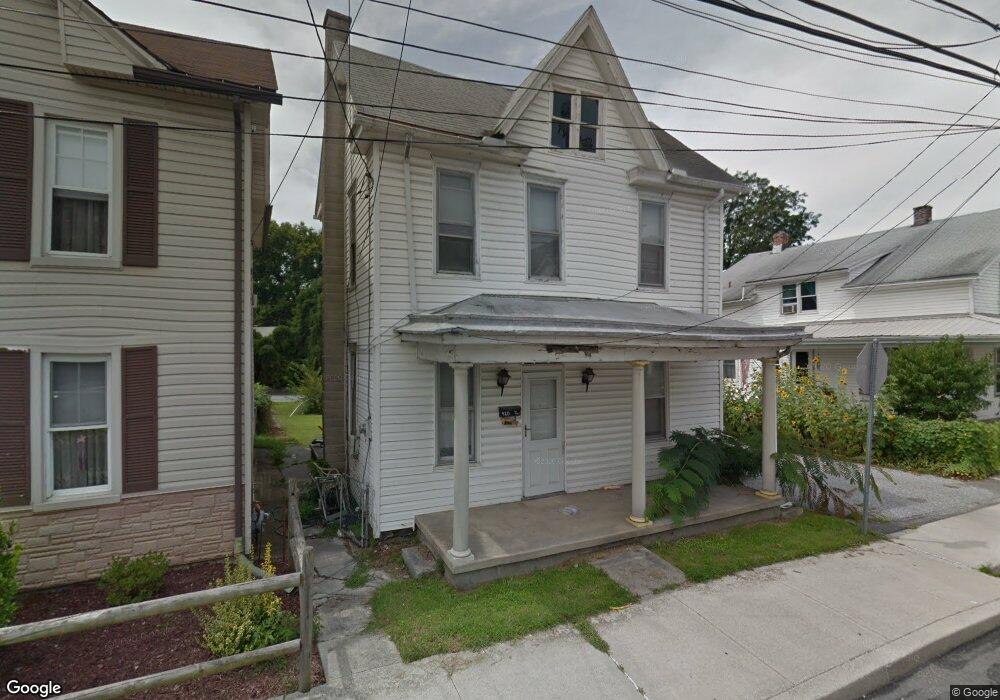
420 3rd St Enola, PA 17025
East Pennsboro NeighborhoodEstimated Value: $200,000 - $216,000
3
Beds
1
Bath
1,344
Sq Ft
$153/Sq Ft
Est. Value
About This Home
This home is located at 420 3rd St, Enola, PA 17025 and is currently estimated at $205,679, approximately $153 per square foot. 420 3rd St is a home located in Cumberland County with nearby schools including East Pennsboro Area Middle School, East Pennsboro Area Senior High School, and Harrisburg Academy.
Ownership History
Date
Name
Owned For
Owner Type
Purchase Details
Closed on
May 18, 2015
Sold by
Cp-Srmof Ii 2012-A Tr Us Bk Tr
Bought by
Tif-Sey Properties Inc
Current Estimated Value
Purchase Details
Closed on
Dec 29, 2004
Sold by
Buffington Meadem
Bought by
Rife John E
Home Financials for this Owner
Home Financials are based on the most recent Mortgage that was taken out on this home.
Original Mortgage
$86,900
Interest Rate
5.73%
Mortgage Type
New Conventional
Create a Home Valuation Report for This Property
The Home Valuation Report is an in-depth analysis detailing your home's value as well as a comparison with similar homes in the area
Home Values in the Area
Average Home Value in this Area
Purchase History
| Date | Buyer | Sale Price | Title Company |
|---|---|---|---|
| Tif-Sey Properties Inc | $30,200 | -- | |
| Rife John E | $86,900 | -- |
Source: Public Records
Mortgage History
| Date | Status | Borrower | Loan Amount |
|---|---|---|---|
| Previous Owner | Rife John E | $86,900 |
Source: Public Records
Tax History Compared to Growth
Tax History
| Year | Tax Paid | Tax Assessment Tax Assessment Total Assessment is a certain percentage of the fair market value that is determined by local assessors to be the total taxable value of land and additions on the property. | Land | Improvement |
|---|---|---|---|---|
| 2025 | $2,851 | $138,100 | $17,100 | $121,000 |
| 2024 | $2,689 | $138,100 | $17,100 | $121,000 |
| 2023 | $2,537 | $138,100 | $17,100 | $121,000 |
| 2022 | $2,385 | $138,100 | $17,100 | $121,000 |
| 2021 | $2,344 | $138,100 | $17,100 | $121,000 |
| 2020 | $17,676 | $138,100 | $17,100 | $121,000 |
| 2019 | $2,262 | $138,100 | $17,100 | $121,000 |
| 2018 | $2,237 | $138,100 | $17,100 | $121,000 |
| 2017 | -- | $138,100 | $17,100 | $121,000 |
| 2016 | -- | $138,100 | $17,100 | $121,000 |
| 2015 | -- | $138,100 | $17,100 | $121,000 |
| 2014 | -- | $138,100 | $17,100 | $121,000 |
Source: Public Records
Map
Nearby Homes