Estimated Value: $348,305 - $430,000
3
Beds
3
Baths
2,529
Sq Ft
$151/Sq Ft
Est. Value
About This Home
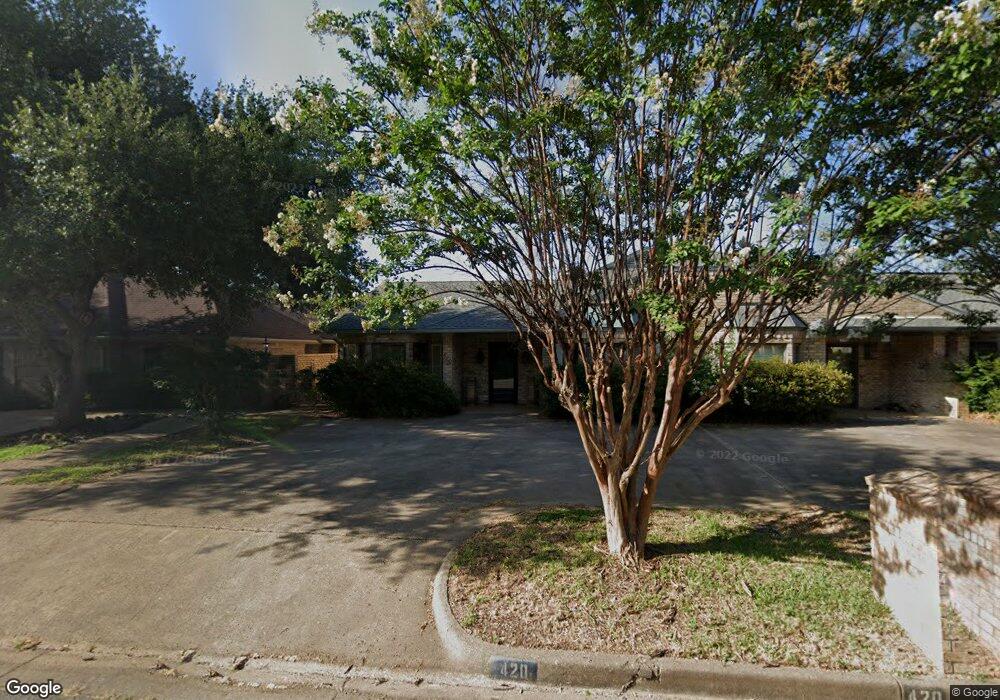
This home is located at 420 420 Woodland Hills Dr, Tyler, TX 75701 and is currently estimated at $382,826, approximately $151 per square foot. 420 420 Woodland Hills Dr is a home located in Smith County with nearby schools including Woods Elementary School, Hubbard Middle School, and Tyler Legacy High School.
Ownership History
Date
Name
Owned For
Owner Type
Purchase Details
Closed on
Oct 23, 2020
Sold by
Lynn Hurst Patti
Bought by
Vanhook Margaret Michelle
Current Estimated Value
Home Financials for this Owner
Home Financials are based on the most recent Mortgage that was taken out on this home.
Original Mortgage
$193,500
Outstanding Balance
$171,400
Interest Rate
2.8%
Mortgage Type
New Conventional
Estimated Equity
$211,426
Purchase Details
Closed on
Sep 29, 2017
Sold by
Shaffer Bootsaba and Walker Boorsaba
Bought by
Hurst Patti Lynn
Home Financials for this Owner
Home Financials are based on the most recent Mortgage that was taken out on this home.
Original Mortgage
$60,000
Interest Rate
3.89%
Mortgage Type
New Conventional
Create a Home Valuation Report for This Property
The Home Valuation Report is an in-depth analysis detailing your home's value as well as a comparison with similar homes in the area
Home Values in the Area
Average Home Value in this Area
Purchase History
| Date | Buyer | Sale Price | Title Company |
|---|---|---|---|
| Vanhook Margaret Michelle | $257,355 | None Listed On Document | |
| Vanhook Margaret Michelle | -- | None Available | |
| Hurst Patti Lynn | -- | Ctc |
Source: Public Records
Mortgage History
| Date | Status | Borrower | Loan Amount |
|---|---|---|---|
| Open | Vanhook Margaret Michelle | $193,500 | |
| Closed | Vanhook Margaret Michelle | $193,500 | |
| Previous Owner | Hurst Patti Lynn | $60,000 |
Source: Public Records
Tax History Compared to Growth
Tax History
| Year | Tax Paid | Tax Assessment Tax Assessment Total Assessment is a certain percentage of the fair market value that is determined by local assessors to be the total taxable value of land and additions on the property. | Land | Improvement |
|---|---|---|---|---|
| 2025 | $5,004 | $372,376 | $45,411 | $326,965 |
| 2024 | $5,004 | $352,749 | $16,466 | $347,561 |
| 2023 | $4,551 | $320,681 | $16,466 | $304,215 |
| 2022 | $5,805 | $296,304 | $16,466 | $279,838 |
| 2021 | $4,594 | $218,965 | $16,466 | $202,499 |
| 2020 | $3,922 | $183,284 | $21,954 | $161,330 |
| 2019 | $3,887 | $177,741 | $21,954 | $155,787 |
| 2018 | $4,038 | $185,645 | $21,954 | $163,691 |
| 2017 | $3,821 | $178,981 | $15,290 | $163,691 |
| 2016 | $3,723 | $174,406 | $15,290 | $159,116 |
| 2015 | $3,567 | $167,650 | $15,290 | $152,360 |
| 2014 | $3,567 | $167,855 | $15,290 | $152,565 |
Source: Public Records
Map
Nearby Homes
- 3617 Jill Cir
- 504 Woodland Hills Dr
- 410 Brighton Ct
- 604-606 Woodland Hills Dr
- 612 Rosemont Place II
- 701 Woodland Hills Dr
- 3308 Greenoak Place
- 815 Woodland Hills Dr
- 3300 Old Bullard Rd
- 505 Buckingham Place
- 509 Buckingham Place
- 3324 Teakwood Dr
- 3606 Glendale Dr
- 403 Beechwood Dr
- 640 Beechwood Dr
- 3500 Silverwood Dr
- 3501 Silverwood Dr
- 3518 Cloverdale Dr
- 3404 Silverwood Dr
- 429 Holiday Ln
- 420 Woodland Hills Dr
- 422 Woodland Hills Dr
- 418 Woodland Hills Dr
- 500 Woodland Hills Dr
- 416 Woodland Hills Dr
- 413 413 Brighton Ct
- 415 415 Brighton Ct
- 415 Brighton Ct
- 413 Brighton Ct
- 502 502 Woodland Hills
- 417 Brighton Ct
- 417 417 Brighton Ct
- 502 Woodland Hills Dr
- 411 411 Brighton
- 411 411 Brighton Crt
- 414 Woodland Hills Dr
- 411 Brighton Ct
- 3624 3624 Jill Cir
- 409 409 Brighton Ct
- 419 Brighton Ct