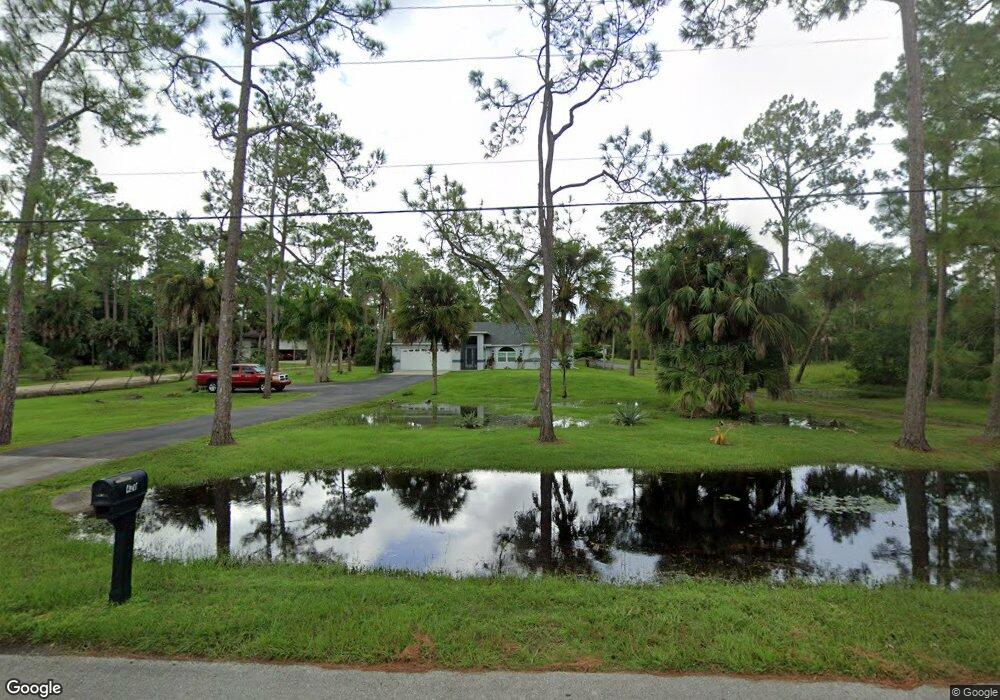
420 7th St SW Naples, FL 34117
Rural Estates NeighborhoodEstimated Value: $550,000 - $1,020,000
--
Bed
--
Bath
2,828
Sq Ft
$265/Sq Ft
Est. Value
About This Home
This home is located at 420 7th St SW, Naples, FL 34117 and is currently estimated at $749,281, approximately $264 per square foot. 420 7th St SW is a home located in Collier County with nearby schools including Big Cypress Elementary School, Cypress Palm Middle School, and Gulf Coast High School.
Ownership History
Date
Name
Owned For
Owner Type
Purchase Details
Closed on
Mar 21, 2025
Sold by
Cordell Joyce L and Wagner Danny L
Bought by
Cordell Joyce Lynn and Wagner Danny Lee
Current Estimated Value
Purchase Details
Closed on
Feb 3, 2025
Sold by
Valmana Fulgencio and Valmana Angela
Bought by
Valmana Fulgencio Faustino and Valmana Angela Maria
Purchase Details
Closed on
Feb 24, 2000
Sold by
Amer Dream Builders Inc
Bought by
Valmana Fulgencio and Valmana Angela
Home Financials for this Owner
Home Financials are based on the most recent Mortgage that was taken out on this home.
Original Mortgage
$145,620
Interest Rate
8.37%
Mortgage Type
VA
Purchase Details
Closed on
Jul 21, 1999
Sold by
Mullins Pete and Mullins Glenna M
Bought by
Amer Dream Bldr Inc
Create a Home Valuation Report for This Property
The Home Valuation Report is an in-depth analysis detailing your home's value as well as a comparison with similar homes in the area
Home Values in the Area
Average Home Value in this Area
Purchase History
| Date | Buyer | Sale Price | Title Company |
|---|---|---|---|
| Cordell Joyce Lynn | -- | -- | |
| Valmana Fulgencio Faustino | -- | -- | |
| Valmana Fulgencio Faustino | -- | -- | |
| Valmana Fulgencio | $142,800 | -- | |
| Amer Dream Bldr Inc | $18,500 | -- |
Source: Public Records
Mortgage History
| Date | Status | Borrower | Loan Amount |
|---|---|---|---|
| Previous Owner | Valmana Fulgencio | $145,620 |
Source: Public Records
Tax History Compared to Growth
Tax History
| Year | Tax Paid | Tax Assessment Tax Assessment Total Assessment is a certain percentage of the fair market value that is determined by local assessors to be the total taxable value of land and additions on the property. | Land | Improvement |
|---|---|---|---|---|
| 2025 | $2,650 | $258,953 | -- | -- |
| 2024 | $2,610 | $251,655 | -- | -- |
| 2023 | $2,610 | $244,325 | $0 | $0 |
| 2022 | $2,626 | $237,209 | $0 | $0 |
| 2021 | $2,634 | $230,300 | $0 | $0 |
| 2020 | $2,572 | $227,120 | $0 | $0 |
| 2019 | $2,521 | $222,014 | $0 | $0 |
| 2018 | $2,462 | $217,874 | $0 | $0 |
| 2017 | $2,415 | $213,393 | $0 | $0 |
| 2016 | $2,341 | $209,004 | $0 | $0 |
| 2015 | $2,353 | $207,551 | $0 | $0 |
| 2014 | $2,344 | $155,904 | $0 | $0 |
Source: Public Records
Map
Nearby Homes
- 430 7th St SW
- 320 7th St SW
- 530 7th St SW
- 540 7th St SW
- 580 7th St SW
- 460 9th St SW
- 491 9th St SW
- 495 9th St SW
- 182 9th St SW
- 180 5th St SW
- 441 3rd St SW
- 810 7th St SW
- 460 3rd St SW
- 620 3rd St SW
- 86 9th St SW
- 721 Golden Gate Blvd W
- 0 9th St SW Unit 225070297
- 0 9th St SW Unit 225081259
- 524 13th St SW
- 538 13th St SW
- 328900 7th St SW
- 130 7th St SW
- 430 7th St SW Unit 12
- 390 7th St SW
- 470 7th St SW
- 370 7th St SW
- 421 7th St SW
- 431 7th St SW
- 490 7th St SW
- 385 7th St SW
- 512 7th St SW
- 320 7th Ave S Unit 6
- 320 7th St SW Unit 200
- 481 7th St SW
- 511 7th St SW
- 280 7th St SW
- 427 5th St SW
- 425 5th St SW
- 441 5th St SW
- 481 5th St SW