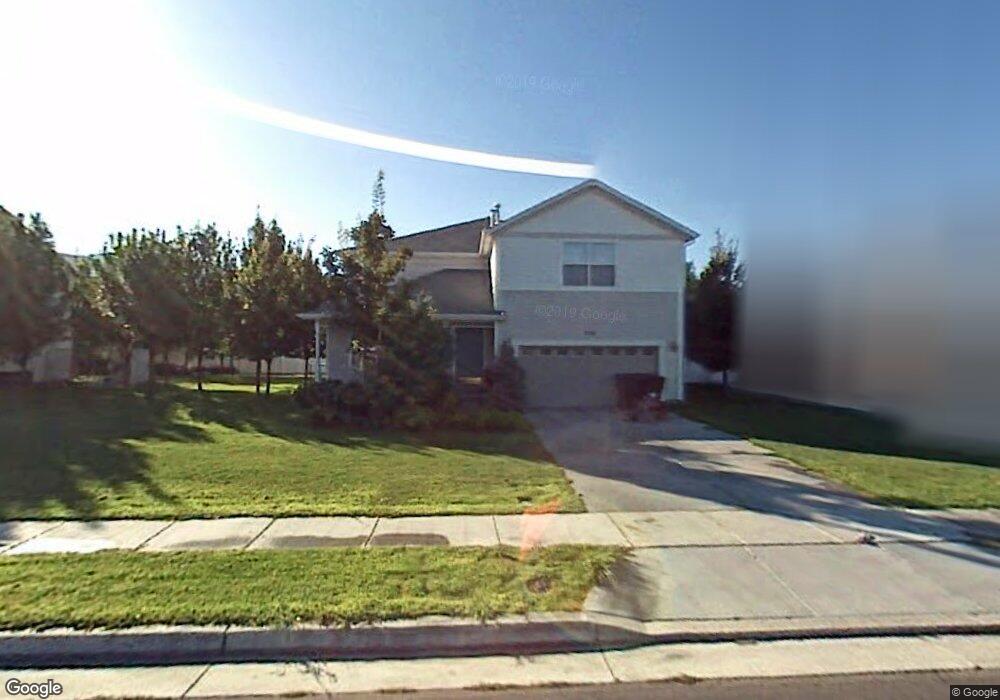
420 Benson Rd Tooele, UT 84074
Estimated Value: $494,270 - $559,000
4
Beds
3
Baths
3,177
Sq Ft
$163/Sq Ft
Est. Value
About This Home
This home is located at 420 Benson Rd, Tooele, UT 84074 and is currently estimated at $517,318, approximately $162 per square foot. 420 Benson Rd is a home located in Tooele County with nearby schools including Stansbury Park Elementary School, Clarke N. Johnsen Junior High School, and Stansbury High School.
Ownership History
Date
Name
Owned For
Owner Type
Purchase Details
Closed on
Oct 7, 2011
Sold by
Grundvig Lynn and Grundvig Amy
Bought by
Grundvig Lynn and Grundvig Amy
Current Estimated Value
Home Financials for this Owner
Home Financials are based on the most recent Mortgage that was taken out on this home.
Original Mortgage
$141,000
Outstanding Balance
$13,288
Interest Rate
4.05%
Mortgage Type
New Conventional
Estimated Equity
$504,030
Purchase Details
Closed on
Feb 19, 2010
Sold by
The Secretary Of Hud
Bought by
Grundvig Lynn and Grundvig Amy
Home Financials for this Owner
Home Financials are based on the most recent Mortgage that was taken out on this home.
Original Mortgage
$138,432
Interest Rate
5.02%
Mortgage Type
New Conventional
Purchase Details
Closed on
Oct 13, 2009
Sold by
Wells Fargo Bank Na
Bought by
Secretary Of Hud
Purchase Details
Closed on
Aug 11, 2009
Sold by
Powers Tameisa N and Powers Jason C
Bought by
Wells Fargo Bank Na
Create a Home Valuation Report for This Property
The Home Valuation Report is an in-depth analysis detailing your home's value as well as a comparison with similar homes in the area
Home Values in the Area
Average Home Value in this Area
Purchase History
| Date | Buyer | Sale Price | Title Company |
|---|---|---|---|
| Grundvig Lynn | -- | Gt Title Services | |
| Grundvig Lynn | -- | Monument Title Ins Co | |
| Secretary Of Hud | -- | None Available | |
| Wells Fargo Bank Na | -- | Etitle Insurance Agency |
Source: Public Records
Mortgage History
| Date | Status | Borrower | Loan Amount |
|---|---|---|---|
| Open | Grundvig Lynn | $141,000 | |
| Closed | Grundvig Lynn | $138,432 |
Source: Public Records
Tax History
| Year | Tax Paid | Tax Assessment Tax Assessment Total Assessment is a certain percentage of the fair market value that is determined by local assessors to be the total taxable value of land and additions on the property. | Land | Improvement |
|---|---|---|---|---|
| 2025 | $3,893 | $492,054 | $136,000 | $356,054 |
| 2024 | $1,224 | $271,635 | $74,800 | $196,835 |
| 2023 | $1,224 | $260,569 | $78,650 | $181,919 |
| 2022 | $3,664 | $294,044 | $65,780 | $228,264 |
| 2021 | $3,339 | $221,344 | $56,155 | $165,189 |
| 2020 | $3,246 | $376,199 | $75,400 | $300,799 |
| 2019 | $2,937 | $334,807 | $75,400 | $259,407 |
| 2018 | $2,634 | $287,607 | $25,000 | $262,607 |
| 2017 | $2,283 | $263,734 | $25,000 | $238,734 |
| 2016 | $1,935 | $127,927 | $13,750 | $114,177 |
| 2015 | $1,935 | $121,464 | $0 | $0 |
| 2014 | -- | $121,464 | $0 | $0 |
Source: Public Records
Map
Nearby Homes
- 501 Water Wheel Ln
- 6842 Bigelow Dr
- 42 Millpond
- 112 Crystal Bay Dr
- 6545 N Valley Point Way
- 33 E Delgada Ln
- 845 Lakeview
- 6757 N Star Discovery Way Unit 1309
- 6799 N Star Discovery Way Unit 1312
- 153 Country Club Dr
- 6412 N Wild Mare Way Unit 1022
- 160 Country Club Dr
- 257 W Palomino Way
- 331 W Wrangler Cove
- 337 W Wrangler Cove
- 583 E Glenpoint Ct
- 796 Lakeview Dr
- 6508 N Spur Ln Unit 1220
- 375 W Palomino Way
- 365 W Box Creek Dr
- 430 Benson Rd
- 410 Benson Rd
- 431 Water Wheel Ln
- 6675 Harvest Ln
- 413 Water Wheel Ln
- 438 Benson Rd
- 402 Wheatridge Rd
- 6665 Harvest Ln
- 439 Water Wheel Ln
- 6665 N Harvest Dr
- 6657 Harvest Ln
- 449 Water Wheel Ln
- 6684 Harvest Ln
- 6676 Harvest Ln
- 424 Water Wheel Ln
- 418 Wheatridge Rd
- 6647 Harvest Ln
- 6666 Harvest Ln
- 444 Water Wheel Ln
- 459 Water Wheel Ln
Your Personal Tour Guide
Ask me questions while you tour the home.