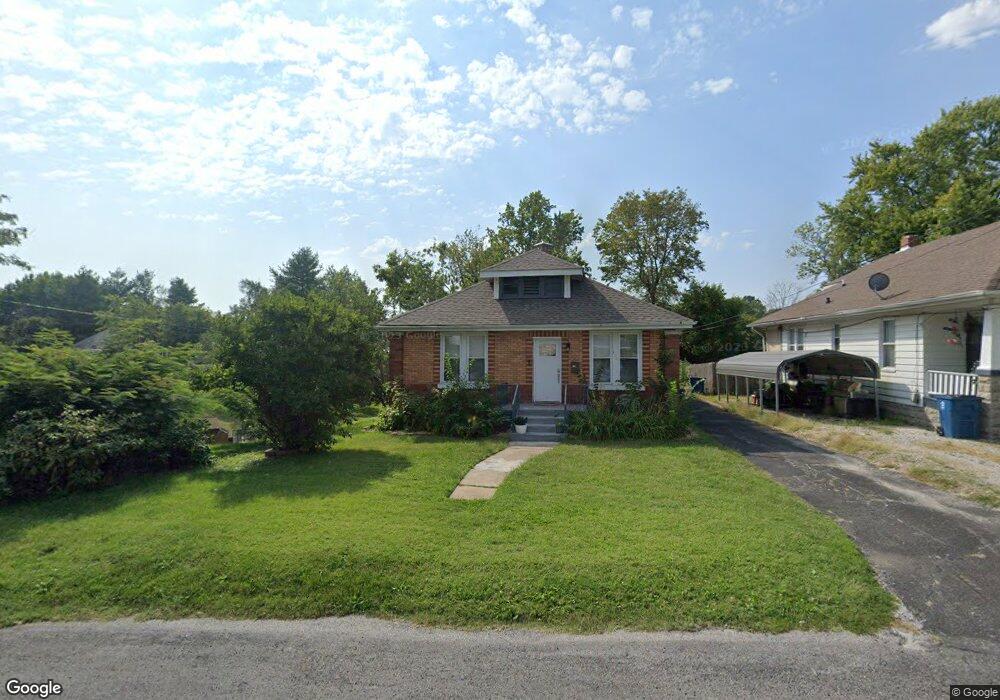
420 Bissell Ave Collinsville, IL 62234
Estimated Value: $156,000 - $175,000
4
Beds
1
Bath
1,393
Sq Ft
$118/Sq Ft
Est. Value
About This Home
This home is located at 420 Bissell Ave, Collinsville, IL 62234 and is currently estimated at $164,254, approximately $117 per square foot. 420 Bissell Ave is a home located in Madison County with nearby schools including John A Renfro Elementary School, Dorris Intermediate School, and Collinsville Middle School.
Ownership History
Date
Name
Owned For
Owner Type
Purchase Details
Closed on
Apr 28, 2023
Sold by
Dinceroglu Aisha
Bought by
Blaylock Gavin and Reamer Alexandra
Current Estimated Value
Home Financials for this Owner
Home Financials are based on the most recent Mortgage that was taken out on this home.
Original Mortgage
$142,373
Outstanding Balance
$138,996
Interest Rate
7.25%
Mortgage Type
FHA
Estimated Equity
$25,258
Purchase Details
Closed on
Nov 23, 2022
Sold by
Judicial Sales Corp
Bought by
Dinceroglu Aisha P
Purchase Details
Closed on
Jan 7, 2004
Sold by
Ponce Gary L and Ponce Robin M
Bought by
Ponce Eric M and Ponce Tracy N
Home Financials for this Owner
Home Financials are based on the most recent Mortgage that was taken out on this home.
Original Mortgage
$81,500
Interest Rate
5.4%
Mortgage Type
New Conventional
Create a Home Valuation Report for This Property
The Home Valuation Report is an in-depth analysis detailing your home's value as well as a comparison with similar homes in the area
Home Values in the Area
Average Home Value in this Area
Purchase History
| Date | Buyer | Sale Price | Title Company |
|---|---|---|---|
| Blaylock Gavin | $145,000 | Abstracts & Titles | |
| Dinceroglu Aisha P | -- | None Available | |
| Ponce Eric M | -- | None Available |
Source: Public Records
Mortgage History
| Date | Status | Borrower | Loan Amount |
|---|---|---|---|
| Open | Blaylock Gavin | $142,373 | |
| Previous Owner | Ponce Eric M | $81,500 |
Source: Public Records
Tax History Compared to Growth
Tax History
| Year | Tax Paid | Tax Assessment Tax Assessment Total Assessment is a certain percentage of the fair market value that is determined by local assessors to be the total taxable value of land and additions on the property. | Land | Improvement |
|---|---|---|---|---|
| 2024 | $2,174 | $40,010 | $9,490 | $30,520 |
| 2023 | $2,174 | $37,030 | $8,780 | $28,250 |
| 2022 | $2,437 | $34,240 | $8,120 | $26,120 |
| 2021 | $2,320 | $33,580 | $8,000 | $25,580 |
| 2020 | $2,236 | $32,040 | $7,630 | $24,410 |
| 2019 | $2,178 | $30,950 | $7,370 | $23,580 |
| 2018 | $2,128 | $29,320 | $6,990 | $22,330 |
| 2017 | $2,132 | $28,740 | $6,850 | $21,890 |
| 2016 | $2,246 | $28,740 | $6,850 | $21,890 |
| 2015 | $1,656 | $28,120 | $8,610 | $19,510 |
| 2014 | $1,656 | $28,120 | $8,610 | $19,510 |
| 2013 | $1,656 | $28,120 | $8,610 | $19,510 |
Source: Public Records
Map
Nearby Homes
- 203 Greenfield Dr
- 1120 Williams St
- 1210 Constance St
- 0 N Keebler Ave
- 1224 Cedar Ridge Ct
- 308 Brown Ave
- 706 Illinois Ave
- 1227 Ridge Ave
- 501 Spring
- 617 N Morrison Ave
- 414 Bunker Hill Dr
- 102 Toni Ct
- 22 Brookwood Dr
- 919 Vine St
- 123 W Wickliffe Ave
- 5 Brookwood Dr
- 892 Lester Ave
- 921 Prospect St
- 0 Strong Ave
- 1002 California Ave
- 416 Bissell Ave
- 33 Bissell Ave
- 0 Bissell Ave
- 33Lot Bissell Ave
- 412 Bissell Ave
- 1112 Roosevelt St Unit 1114
- 1114 Roosevelt St
- 408 Bissell Ave
- 423 Bissell Ave
- 421 Bissell Ave
- 1108 Roosevelt St Unit 1110
- 417 Bissell Ave
- 425 Bissell Ave
- 402 Bissell Ave
- 501 Larue St
- 427 Bissell Ave
- 505 Larue St
- 409 Bissell Ave
- 1104 Roosevelt St
- 405 Bissell Ave