Estimated Value: $202,000 - $243,000
3
Beds
2
Baths
1,760
Sq Ft
$123/Sq Ft
Est. Value
About This Home
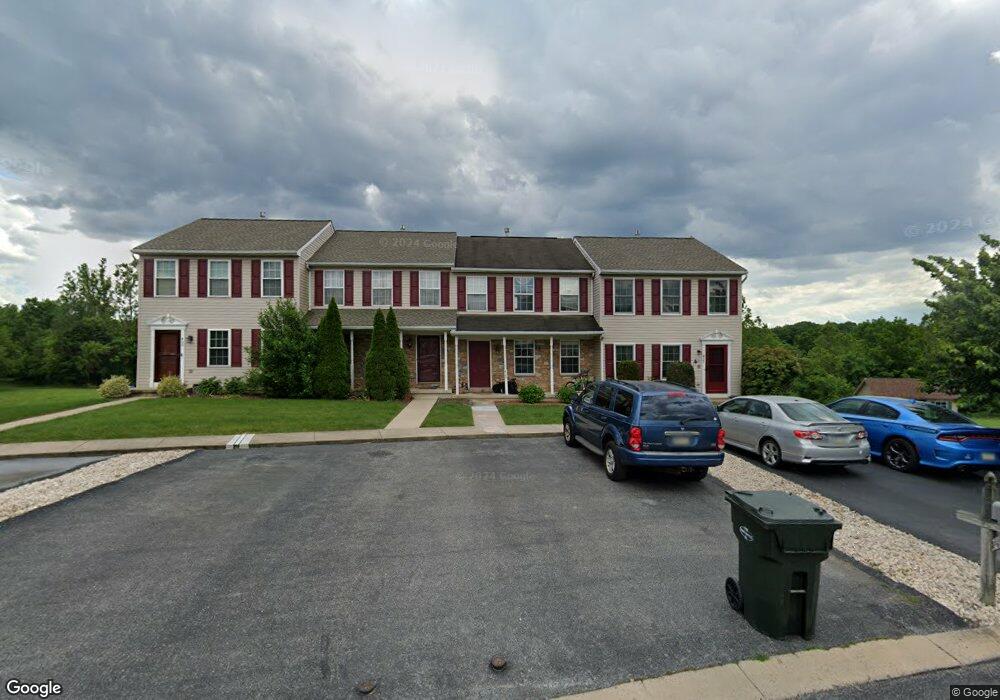
This home is located at 420 Charles Cir, York, PA 17406 and is currently estimated at $216,812, approximately $123 per square foot. 420 Charles Cir is a home located in York County with nearby schools including Eastern York High School and The Montessori Children's House of York.
Ownership History
Date
Name
Owned For
Owner Type
Purchase Details
Closed on
Aug 28, 2015
Sold by
Mcneil Eric D and Mcneil Frances K
Bought by
Cunningham Seve R and Cunningham Sierra R
Current Estimated Value
Home Financials for this Owner
Home Financials are based on the most recent Mortgage that was taken out on this home.
Original Mortgage
$122,637
Outstanding Balance
$96,192
Interest Rate
3.87%
Mortgage Type
FHA
Estimated Equity
$120,620
Purchase Details
Closed on
Oct 8, 2014
Sold by
Askey Frances K and Mcneil Eric D
Bought by
Mcneil Eric D and Mcneil Frances K
Purchase Details
Closed on
May 17, 2010
Sold by
Hammill Sonya D and Hammill John
Bought by
Askey Frances K
Home Financials for this Owner
Home Financials are based on the most recent Mortgage that was taken out on this home.
Original Mortgage
$5,000
Interest Rate
5.13%
Mortgage Type
Unknown
Purchase Details
Closed on
Jul 17, 2001
Sold by
Cornerstone At Buttonwood Ltd Prtnrshp
Bought by
Plummer Sonya D
Create a Home Valuation Report for This Property
The Home Valuation Report is an in-depth analysis detailing your home's value as well as a comparison with similar homes in the area
Home Values in the Area
Average Home Value in this Area
Purchase History
| Date | Buyer | Sale Price | Title Company |
|---|---|---|---|
| Cunningham Seve R | $124,900 | None Available | |
| Mcneil Eric D | -- | None Available | |
| Askey Frances K | $140,000 | None Available | |
| Plummer Sonya D | $97,114 | -- |
Source: Public Records
Mortgage History
| Date | Status | Borrower | Loan Amount |
|---|---|---|---|
| Open | Cunningham Seve R | $122,637 | |
| Previous Owner | Askey Frances K | $5,000 | |
| Previous Owner | Askey Frances K | $137,464 |
Source: Public Records
Tax History Compared to Growth
Tax History
| Year | Tax Paid | Tax Assessment Tax Assessment Total Assessment is a certain percentage of the fair market value that is determined by local assessors to be the total taxable value of land and additions on the property. | Land | Improvement |
|---|---|---|---|---|
| 2025 | $1,194 | $86,300 | $23,880 | $62,420 |
| 2024 | $3,217 | $86,300 | $23,880 | $62,420 |
| 2023 | $3,217 | $86,300 | $23,880 | $62,420 |
| 2022 | $3,089 | $86,300 | $23,880 | $62,420 |
| 2021 | $3,043 | $86,300 | $23,880 | $62,420 |
| 2020 | $3,043 | $86,300 | $23,880 | $62,420 |
| 2019 | $2,915 | $86,300 | $23,880 | $62,420 |
| 2018 | $2,844 | $86,300 | $23,880 | $62,420 |
| 2017 | $2,738 | $86,300 | $23,880 | $62,420 |
| 2016 | $0 | $86,300 | $23,880 | $62,420 |
| 2015 | -- | $86,300 | $23,880 | $62,420 |
| 2014 | -- | $86,300 | $23,880 | $62,420 |
Source: Public Records
Map
Nearby Homes
- 445 Charles Cir
- 416 Friendship Ave
- 436B Buttonwood Ln Unit 436B
- 1 S Broad St
- 0 S Broad St
- 196 S Broad St
- 370 E Market St
- 80 W Market St
- 65 N Prospect St
- 452 Fitzpatrick Ln
- 215 Frysville Rd
- 695 Frysville Rd
- 4860 Yorkana Rd
- 4785 Baer Valley Ln
- 0 Jamestown Model at Eagles View Unit PAYK2079830
- 4761 Baer Valley Ln
- 93 Main St
- 81 Main St
- 67 Main St
- 59 Main St Unit 306
- 410 Charles Cir
- 430 Charles Cir
- 400 Charles Cir
- 390 Charles Cir
- 395 Charles Cir
- 380 Charles Cir
- 385 Charles Cir
- 370 Charles Cir
- 375 Charles Cir
- 440 Charles Cir
- 360 Charles Cir
- 355 Charles Cir
- 350 Charles Cir
- 450 Charles Cir
- 345 Charles Cir
- 340 Charles Cir
- 460 Charles Cir
- 455 Charles Cir
- 335 Charles Cir
- 330 Charles Cir