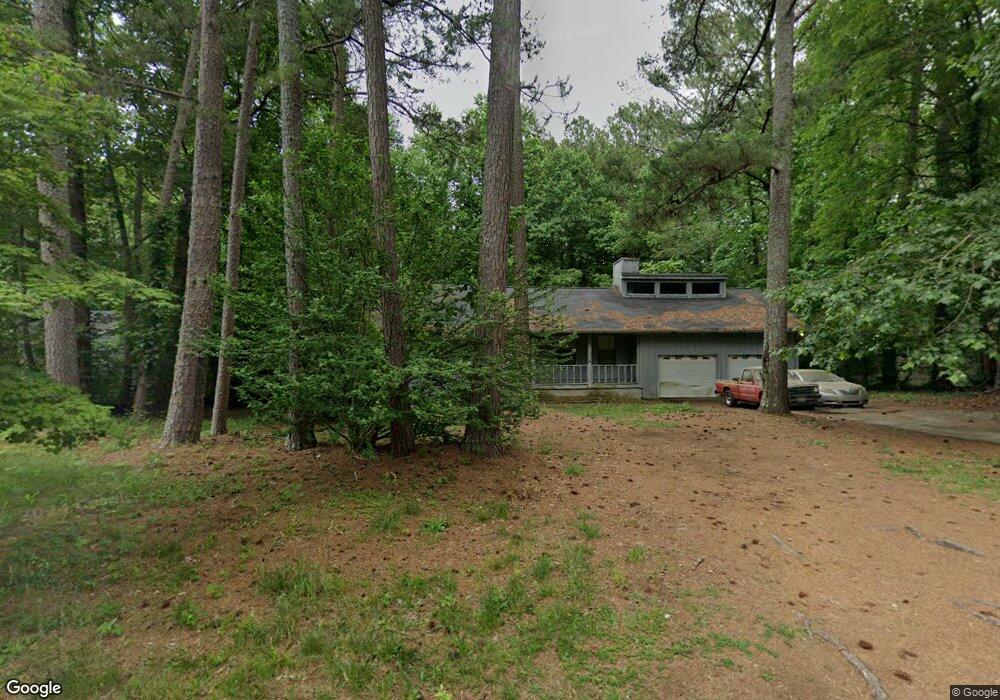
420 Creekside Ln Woodstock, GA 30188
Estimated Value: $341,028 - $347,000
3
Beds
2
Baths
1,350
Sq Ft
$255/Sq Ft
Est. Value
About This Home
This home is located at 420 Creekside Ln, Woodstock, GA 30188 and is currently estimated at $344,014, approximately $254 per square foot. 420 Creekside Ln is a home located in Cherokee County with nearby schools including Little River Elementary, Mill Creek Middle School, and River Ridge High School.
Ownership History
Date
Name
Owned For
Owner Type
Purchase Details
Closed on
Sep 18, 2009
Sold by
Ganka Geordan E
Bought by
Sanford Robert V and Sanford Monique
Current Estimated Value
Home Financials for this Owner
Home Financials are based on the most recent Mortgage that was taken out on this home.
Original Mortgage
$127,176
Outstanding Balance
$82,834
Interest Rate
5.11%
Estimated Equity
$261,180
Purchase Details
Closed on
Dec 14, 2007
Sold by
Federal National Mortgage Association
Bought by
Ganka Geordan E
Home Financials for this Owner
Home Financials are based on the most recent Mortgage that was taken out on this home.
Original Mortgage
$125,000
Interest Rate
6.21%
Purchase Details
Closed on
Aug 7, 2007
Sold by
Forister Gerald D and Forister Carolyn Y
Bought by
Countrywide Home Loans Inc
Create a Home Valuation Report for This Property
The Home Valuation Report is an in-depth analysis detailing your home's value as well as a comparison with similar homes in the area
Home Values in the Area
Average Home Value in this Area
Purchase History
| Date | Buyer | Sale Price | Title Company |
|---|---|---|---|
| Sanford Robert V | $124,500 | -- | |
| Ganka Geordan E | -- | -- | |
| Countrywide Home Loans Inc | $121,547 | -- |
Source: Public Records
Mortgage History
| Date | Status | Borrower | Loan Amount |
|---|---|---|---|
| Open | Sanford Robert V | $127,176 | |
| Previous Owner | Ganka Geordan E | $125,000 |
Source: Public Records
Tax History Compared to Growth
Tax History
| Year | Tax Paid | Tax Assessment Tax Assessment Total Assessment is a certain percentage of the fair market value that is determined by local assessors to be the total taxable value of land and additions on the property. | Land | Improvement |
|---|---|---|---|---|
| 2024 | $2,443 | $96,860 | $25,600 | $71,260 |
| 2023 | $2,163 | $104,220 | $29,200 | $75,020 |
| 2022 | $2,457 | $93,500 | $20,000 | $73,500 |
| 2021 | $2,414 | $85,020 | $18,000 | $67,020 |
| 2020 | $2,067 | $72,740 | $13,600 | $59,140 |
| 2019 | $1,792 | $63,080 | $13,600 | $49,480 |
| 2018 | $1,727 | $60,400 | $13,600 | $46,800 |
| 2017 | $1,699 | $147,400 | $13,600 | $45,360 |
| 2016 | $1,609 | $138,200 | $12,800 | $42,480 |
| 2015 | $1,394 | $118,500 | $12,000 | $35,400 |
| 2014 | $1,293 | $109,700 | $10,200 | $33,680 |
Source: Public Records
Map
Nearby Homes
- 419 Creekside Ln
- 1361 Chatley Way
- 406 Creekside Ln Unit 3
- 137 Creekview Dr
- 776 Woodstock Grove Dr
- 1388 Chatley Way
- 338 Cherryhill Ln
- 532 Walton Dr
- 315 Lakeside Ln
- 403 Village View
- 200 Edinburgh Ln
- 304 Winchester Way
- 120 Via Roma
- 11511 Highway 92
- 130 Village Trail
- 253 Dahlia Dr
- 304 Marigold Ln
- 1784 Grand Oaks Dr
- 320 Marigold Ln
- 422 Creekside Ln
- 418 Creekside Ln Unit 3
- 424 Creekside Ln
- 423 Creekside Ln
- 425 Creekside Ln
- 421 Creekside Ln
- 507 Creekridge Ct
- 414 Creekside Ln Unit 3
- 427 Creekside Ln Unit 3
- 426 Creekside Ln
- 505 Creekridge Ct
- 509 Creekridge Ct
- 412 Creekside Ln
- 1362 Chatley Way
- 1360 Chatley Way
- 1364 Chatley Way
- 428 Creekside Ln
- 413 Creekside Ln Unit 2
- 1358 Chatley Way
- 1366 Chatley Way