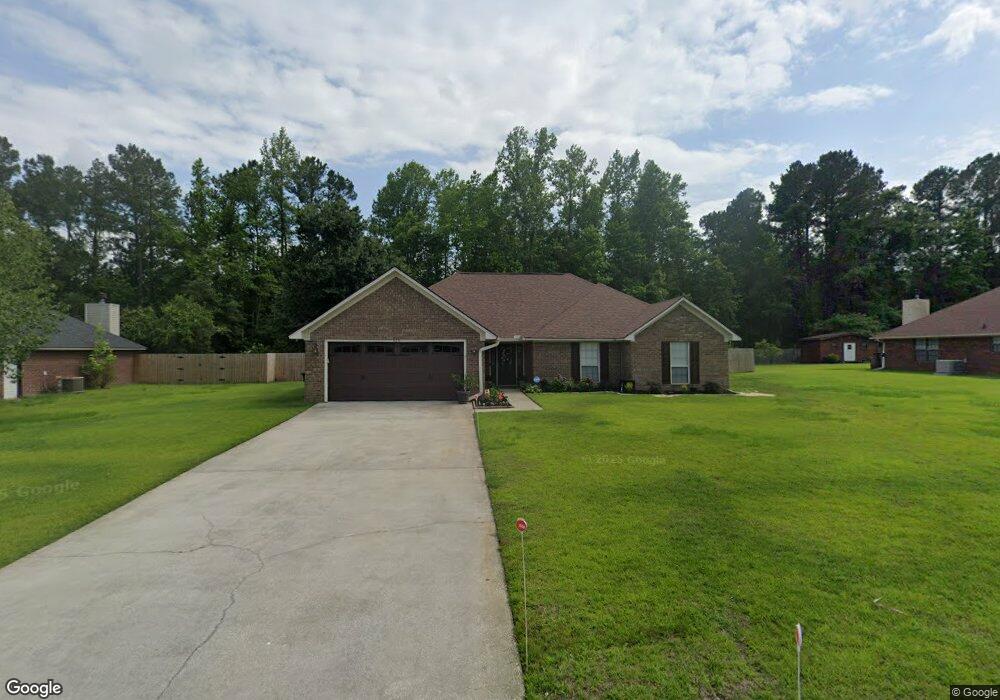
420 Deloach Dr Hinesville, GA 31313
Estimated Value: $274,813 - $303,000
3
Beds
2
Baths
2,118
Sq Ft
$136/Sq Ft
Est. Value
About This Home
This home is located at 420 Deloach Dr, Hinesville, GA 31313 and is currently estimated at $287,953, approximately $135 per square foot. 420 Deloach Dr is a home located in Liberty County with nearby schools including Frank Long Elementary School, Lewis Frasier Middle School, and Liberty County High School.
Ownership History
Date
Name
Owned For
Owner Type
Purchase Details
Closed on
Nov 6, 2019
Sold by
Hall Pamela A
Bought by
Siefken Pamela A and Siefken Adam Paul
Current Estimated Value
Home Financials for this Owner
Home Financials are based on the most recent Mortgage that was taken out on this home.
Original Mortgage
$152,300
Outstanding Balance
$132,768
Interest Rate
3.5%
Estimated Equity
$155,185
Purchase Details
Closed on
Jun 9, 2008
Sold by
Krumwiede Charles D
Bought by
Hall Pamela A
Home Financials for this Owner
Home Financials are based on the most recent Mortgage that was taken out on this home.
Original Mortgage
$169,900
Interest Rate
6.04%
Mortgage Type
New Conventional
Purchase Details
Closed on
Apr 27, 2004
Sold by
Peterson Kenneth M and Peterson Jill M
Bought by
Drumwiede Charles D and Drumwiede Rebecca A
Purchase Details
Closed on
Jun 12, 2000
Sold by
Dryden Enterprises
Bought by
Peterson Kenneth M
Purchase Details
Closed on
Dec 1, 1999
Sold by
Coastal Bank
Bought by
Dryden Enterprises
Purchase Details
Closed on
Dec 10, 1996
Sold by
Buck Home Bldrs
Bought by
Coastal Bank
Purchase Details
Closed on
Apr 28, 1986
Bought by
Buck Home Bldrs
Create a Home Valuation Report for This Property
The Home Valuation Report is an in-depth analysis detailing your home's value as well as a comparison with similar homes in the area
Home Values in the Area
Average Home Value in this Area
Purchase History
| Date | Buyer | Sale Price | Title Company |
|---|---|---|---|
| Siefken Pamela A | -- | -- | |
| Hall Pamela A | $189,900 | -- | |
| Drumwiede Charles D | $141,000 | -- | |
| Peterson Kenneth M | $128,000 | -- | |
| Dryden Enterprises | $68,300 | -- | |
| Coastal Bank | -- | -- | |
| Buck Home Bldrs | -- | -- |
Source: Public Records
Mortgage History
| Date | Status | Borrower | Loan Amount |
|---|---|---|---|
| Open | Siefken Pamela A | $152,300 | |
| Previous Owner | Hall Pamela A | $169,900 |
Source: Public Records
Tax History Compared to Growth
Tax History
| Year | Tax Paid | Tax Assessment Tax Assessment Total Assessment is a certain percentage of the fair market value that is determined by local assessors to be the total taxable value of land and additions on the property. | Land | Improvement |
|---|---|---|---|---|
| 2024 | $4,940 | $100,727 | $12,000 | $88,727 |
| 2023 | $4,940 | $90,416 | $12,000 | $78,416 |
| 2022 | $3,369 | $72,464 | $12,000 | $60,464 |
| 2021 | $3,133 | $66,135 | $12,000 | $54,135 |
| 2020 | $3,064 | $64,054 | $12,000 | $52,054 |
| 2019 | $3,070 | $64,676 | $12,000 | $52,676 |
| 2018 | $3,083 | $65,300 | $12,000 | $53,300 |
| 2017 | $2,171 | $65,930 | $12,000 | $53,930 |
| 2016 | $2,993 | $66,560 | $12,000 | $54,560 |
| 2015 | $3,303 | $69,427 | $12,000 | $57,427 |
| 2014 | $3,303 | $72,697 | $12,000 | $60,697 |
| 2013 | -- | $67,740 | $12,000 | $55,740 |
Source: Public Records
Map
Nearby Homes
- 411 Christopher Dr
- 408 Flowers Dr
- 818 W Oglethorpe Hwy
- 904 W Oglethorpe Hwy
- 14.27 +/- W Oglethorpe Hwy
- MULTIPLE W Oglethorpe Hwy
- Tract 2 W Oglethorpe Hwy
- Tract 4 W Oglethorpe Hwy
- 0 W Oglethorpe Hwy
- 832 W Oglethorpe Hwy
- 1138 Montclair Dr
- 330 Wexford Dr
- 0 U S 84
- 14.27+/- Oglethorpe Hwy
- 1162 Cumberland Dr
- 1107 Fairfax Ct
- 1100 Spruce St
- 927 Charles C Frasier Blvd
- 0 Lake Jordan Dr
- 940 Fox Haven Ct
- 418 Deloach Dr
- 422 Deloach Dr
- 416 Deloach Dr
- 419 Deloach Dr
- 424 Deloach Dr
- 911 Byrum Dr
- 414 Deloach Dr
- 426 Deloach Dr
- 415 Deloach Dr
- 910 Byrum Dr
- 418 Christopher Dr
- 909 Byrum Dr
- 416 Christopher Dr
- 413 Deloach Dr Unit 80
- 413 Deloach Dr
- 412 Deloach Dr
- 414 Christopher Dr
- 908 Byrum Dr
- 412 Christopher Dr
- 411 Deloach Dr