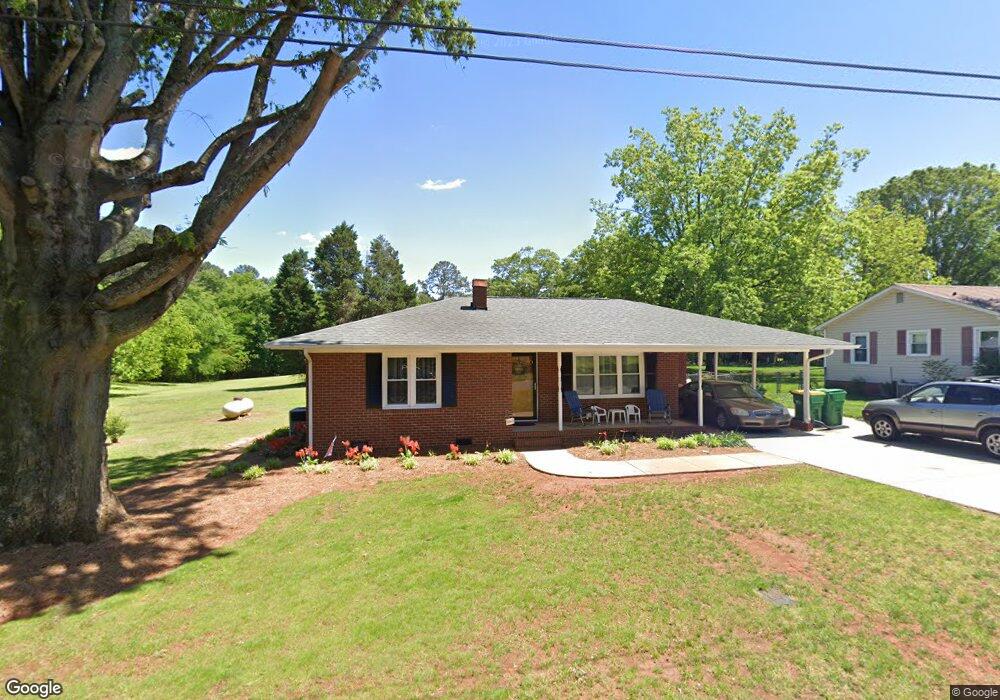
420 E 5th St Oakboro, NC 28129
Estimated Value: $293,897 - $319,000
3
Beds
2
Baths
1,650
Sq Ft
$183/Sq Ft
Est. Value
About This Home
This home is located at 420 E 5th St, Oakboro, NC 28129 and is currently estimated at $302,299, approximately $183 per square foot. 420 E 5th St is a home located in Stanly County with nearby schools including Aquadale Elementary School, South Stanly Middle School, and South Stanly High School.
Ownership History
Date
Name
Owned For
Owner Type
Purchase Details
Closed on
Mar 29, 2018
Sold by
Afre 1 Llc
Bought by
Sanders Dannis Matthew and Sanders Rachel Jewell
Current Estimated Value
Create a Home Valuation Report for This Property
The Home Valuation Report is an in-depth analysis detailing your home's value as well as a comparison with similar homes in the area
Purchase History
| Date | Buyer | Sale Price | Title Company |
|---|---|---|---|
| Sanders Dannis Matthew | $225,000 | None Available |
Source: Public Records
Tax History
| Year | Tax Paid | Tax Assessment Tax Assessment Total Assessment is a certain percentage of the fair market value that is determined by local assessors to be the total taxable value of land and additions on the property. | Land | Improvement |
|---|---|---|---|---|
| 2025 | $1,859 | $191,600 | $21,675 | $169,925 |
| 2024 | $3,359 | $119,673 | $14,025 | $105,648 |
| 2023 | $2,846 | $119,673 | $14,025 | $105,648 |
| 2022 | $1,221 | $119,673 | $14,025 | $105,648 |
| 2021 | $1,221 | $119,673 | $14,025 | $105,648 |
| 2020 | $1,013 | $94,758 | $11,475 | $83,283 |
| 2019 | $1,023 | $94,758 | $11,475 | $83,283 |
| 2018 | $1,652 | $94,758 | $11,475 | $83,283 |
| 2017 | $1,023 | $94,758 | $11,475 | $83,283 |
| 2016 | $994 | $92,015 | $10,200 | $81,815 |
| 2015 | $1,004 | $92,015 | $10,200 | $81,815 |
| 2014 | $1,007 | $92,015 | $10,200 | $81,815 |
Source: Public Records
Map
Nearby Homes
- 304 E 2nd St
- 0 McCoys Creek Rd Unit CAR4344961
- 921 N Long Street Extension
- 426 E 10th St Unit 1
- 424 N Center St
- 000 Alonzo Rd
- 417 Oakleigh Ln
- 307 Jaida Ln
- 635 Scarlet Leaf Ln
- 117 Thomas Ave
- 221 Pecan Dr
- 554 Claymon Rd
- 0000 N Carolina 138
- 213 Carrie Dr
- 277 Glenwood Dr
- 573 Wade Rd
- 1228 Swift Rd
- 783 Hathcock Glen Dr
- 14309 Liberty Hill Church Rd
- 841 Old Farm Rd
Your Personal Tour Guide
Ask me questions while you tour the home.