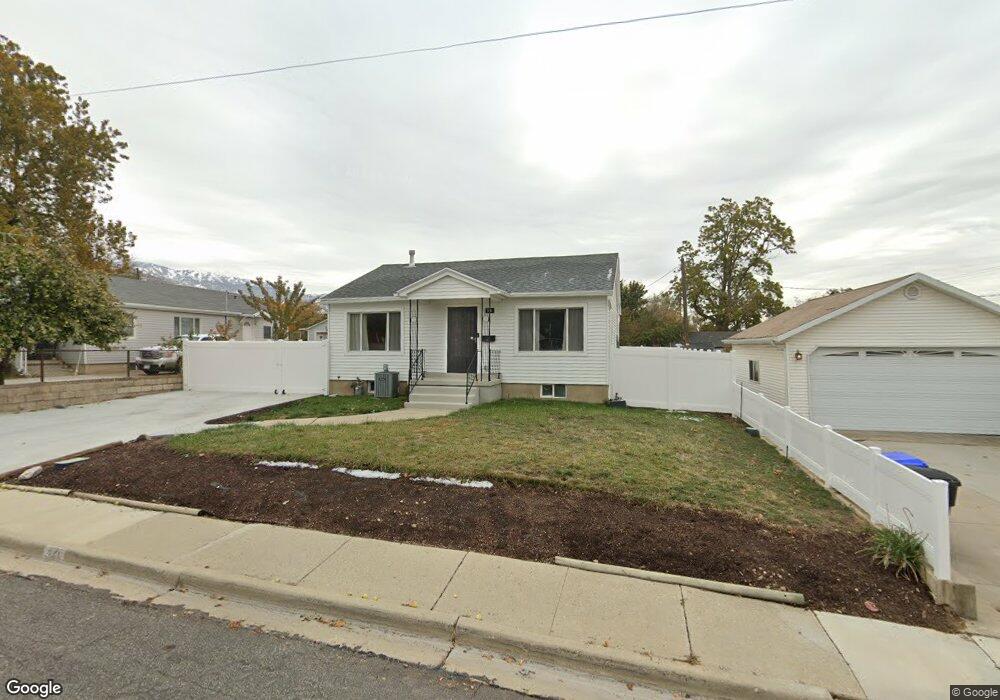
420 E 900 N Bountiful, UT 84010
Estimated Value: $443,000 - $565,000
4
Beds
2
Baths
1,620
Sq Ft
$316/Sq Ft
Est. Value
About This Home
This home is located at 420 E 900 N, Bountiful, UT 84010 and is currently estimated at $511,700, approximately $315 per square foot. 420 E 900 N is a home located in Davis County with nearby schools including Tolman School, Bountiful Junior High School, and Bountiful High School.
Ownership History
Date
Name
Owned For
Owner Type
Purchase Details
Closed on
May 23, 2022
Sold by
Mascone Diane M
Bought by
Brambrough Devan
Current Estimated Value
Home Financials for this Owner
Home Financials are based on the most recent Mortgage that was taken out on this home.
Original Mortgage
$439,120
Outstanding Balance
$417,154
Interest Rate
5.25%
Mortgage Type
New Conventional
Estimated Equity
$94,546
Purchase Details
Closed on
Jul 29, 2021
Sold by
Resilient Properties Llc
Bought by
Mascone Diane M
Purchase Details
Closed on
Dec 18, 2020
Sold by
Green Leslee A and Estate Of Nolan Lynn Torry
Bought by
Resilient Holdings Llc
Home Financials for this Owner
Home Financials are based on the most recent Mortgage that was taken out on this home.
Original Mortgage
$225,000
Interest Rate
2.7%
Mortgage Type
Commercial
Create a Home Valuation Report for This Property
The Home Valuation Report is an in-depth analysis detailing your home's value as well as a comparison with similar homes in the area
Purchase History
| Date | Buyer | Sale Price | Title Company |
|---|---|---|---|
| Brambrough Devan | -- | Cotton Land Title | |
| Mascone Diane M | -- | North American Title | |
| Resilient Holdings Llc | -- | Us Title Company Of U |
Source: Public Records
Mortgage History
| Date | Status | Borrower | Loan Amount |
|---|---|---|---|
| Open | Brambrough Devan | $439,120 | |
| Previous Owner | Resilient Holdings Llc | $225,000 |
Source: Public Records
Tax History Compared to Growth
Tax History
| Year | Tax Paid | Tax Assessment Tax Assessment Total Assessment is a certain percentage of the fair market value that is determined by local assessors to be the total taxable value of land and additions on the property. | Land | Improvement |
|---|---|---|---|---|
| 2025 | $2,625 | $240,350 | $105,871 | $134,479 |
| 2024 | $2,461 | $234,300 | $97,997 | $136,303 |
| 2023 | $2,369 | $409,000 | $172,718 | $236,282 |
| 2022 | $2,488 | $235,950 | $91,291 | $144,659 |
| 2021 | $1,774 | $253,000 | $135,270 | $117,730 |
| 2020 | $1,659 | $238,000 | $123,279 | $114,721 |
| 2019 | $231 | $235,000 | $132,726 | $102,274 |
| 2018 | $200 | $212,000 | $121,702 | $90,298 |
| 2016 | $25 | $98,780 | $34,432 | $64,348 |
| 2015 | $1,320 | $93,005 | $34,432 | $58,573 |
| 2014 | $160 | $93,076 | $34,432 | $58,644 |
| 2013 | -- | $85,211 | $38,760 | $46,451 |
Source: Public Records
Map
Nearby Homes