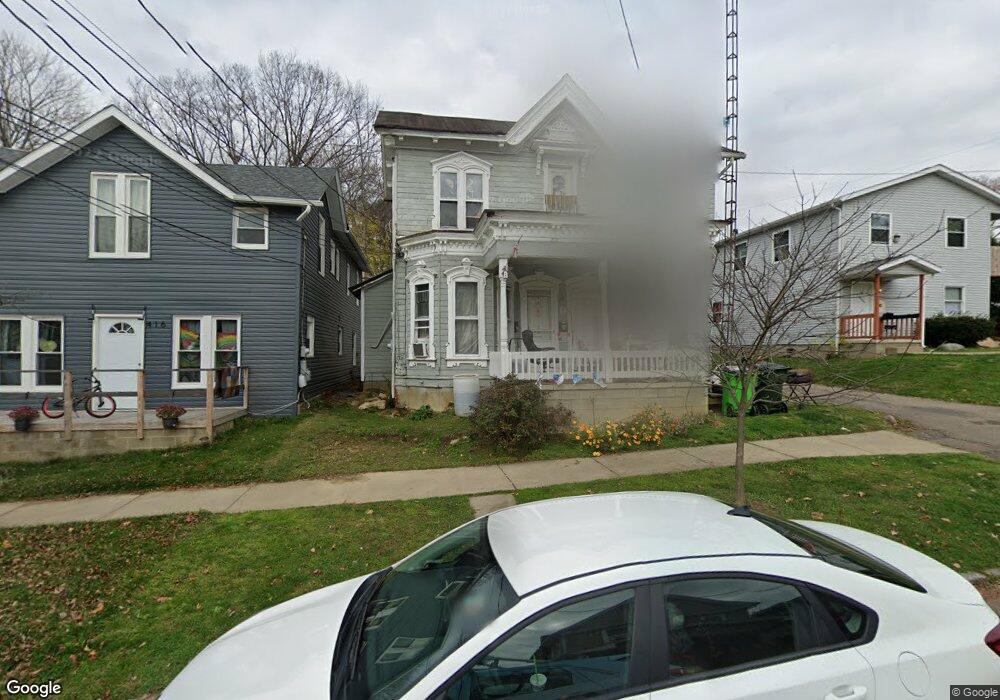
420 E Larwill St Wooster, OH 44691
Estimated Value: $160,000 - $163,000
7
Beds
3
Baths
2,492
Sq Ft
$65/Sq Ft
Est. Value
About This Home
This home is located at 420 E Larwill St, Wooster, OH 44691 and is currently estimated at $162,000, approximately $65 per square foot. 420 E Larwill St is a home located in Wayne County with nearby schools including Cornerstone Elementary School, Edgewood Middle School, and Wooster High School.
Ownership History
Date
Name
Owned For
Owner Type
Purchase Details
Closed on
Apr 7, 2021
Sold by
Zimmerly Brice
Bought by
Brz Properties Llc
Current Estimated Value
Purchase Details
Closed on
Jul 18, 2017
Sold by
Zimmerly Michael D and Zimmerly Diane L
Bought by
Zimmerly Brice
Home Financials for this Owner
Home Financials are based on the most recent Mortgage that was taken out on this home.
Original Mortgage
$150,000
Interest Rate
3.89%
Mortgage Type
Seller Take Back
Purchase Details
Closed on
Sep 30, 2015
Sold by
Zimmerly Michael D and Zimmerly Diane L
Bought by
Kauffman Gregory A
Home Financials for this Owner
Home Financials are based on the most recent Mortgage that was taken out on this home.
Original Mortgage
$75,000
Interest Rate
3.5%
Mortgage Type
Seller Take Back
Purchase Details
Closed on
Jan 6, 2006
Sold by
Schar Darryl L and Schar Douglas E
Bought by
Rhamy Donald E and Rhamy Joyce I
Purchase Details
Closed on
Mar 6, 1987
Bought by
Schar Darryl L
Create a Home Valuation Report for This Property
The Home Valuation Report is an in-depth analysis detailing your home's value as well as a comparison with similar homes in the area
Home Values in the Area
Average Home Value in this Area
Purchase History
| Date | Buyer | Sale Price | Title Company |
|---|---|---|---|
| Brz Properties Llc | -- | None Available | |
| Zimmerly Brice | $175,000 | None Available | |
| Kauffman Gregory A | $75,000 | Attorney | |
| Rhamy Donald E | $78,500 | None Available | |
| Schar Darryl L | -- | -- |
Source: Public Records
Mortgage History
| Date | Status | Borrower | Loan Amount |
|---|---|---|---|
| Previous Owner | Zimmerly Brice | $150,000 | |
| Previous Owner | Kauffman Gregory A | $75,000 |
Source: Public Records
Tax History
| Year | Tax Paid | Tax Assessment Tax Assessment Total Assessment is a certain percentage of the fair market value that is determined by local assessors to be the total taxable value of land and additions on the property. | Land | Improvement |
|---|---|---|---|---|
| 2024 | $1,507 | $35,590 | $7,460 | $28,130 |
| 2023 | $1,513 | $35,590 | $7,460 | $28,130 |
| 2022 | $1,350 | $25,240 | $5,290 | $19,950 |
| 2021 | $1,391 | $25,240 | $5,290 | $19,950 |
| 2020 | $1,321 | $25,240 | $5,290 | $19,950 |
| 2019 | $1,544 | $28,300 | $4,680 | $23,620 |
| 2018 | $1,548 | $28,300 | $4,680 | $23,620 |
| 2017 | $1,561 | $28,300 | $4,680 | $23,620 |
| 2016 | $3,585 | $27,210 | $4,500 | $22,710 |
| 2015 | $1,581 | $27,210 | $4,500 | $22,710 |
| 2014 | $1,582 | $27,210 | $4,500 | $22,710 |
| 2013 | $1,600 | $27,180 | $4,450 | $22,730 |
Source: Public Records
Map
Nearby Homes
- 419 Nold Ave
- 331 Derr Ave
- 223 E Larwill St
- 423 N Market St
- 534 N Buckeye St
- 606 E Henry St
- 134 E Bowman St Unit 1/2
- 227 N Walnut St
- 230 Clark Ave
- 814 N Bever St
- 920 Washington St
- 938 Washington St
- 140 Ohio St
- 1117 Quinby Ave
- 851 Park Blvd
- 5 E Melrose Unit 5
- 758 Western Dr
- 801 & 803 Colony Ct
- 1575 Bellevue Dr
- 1552 Renwood Dr
- 426 E Larwill St
- 416 E Larwill St
- 416 E Larwill St Unit Front Triplex Apt 1
- 416 E Larwill St Unit Rear Duplex Upper
- 408 E Larwill St
- 404 E Larwill St
- 321 College Ave
- 409 E Larwill St
- 405 E Larwill St
- 364 E Larwill St
- 435 E Larwill St
- 348 E Larwill St
- 423 E Larwill St
- 427 Nold Ave
- 425 E Larwill St
- 409 Nold Ave
- 415 E Larwill St
- 433 Nold Ave
- 329 College Ave
- 306 Beall Ave
Your Personal Tour Guide
Ask me questions while you tour the home.