Estimated Value: $262,000 - $327,606
3
Beds
3
Baths
1,407
Sq Ft
$200/Sq Ft
Est. Value
About This Home
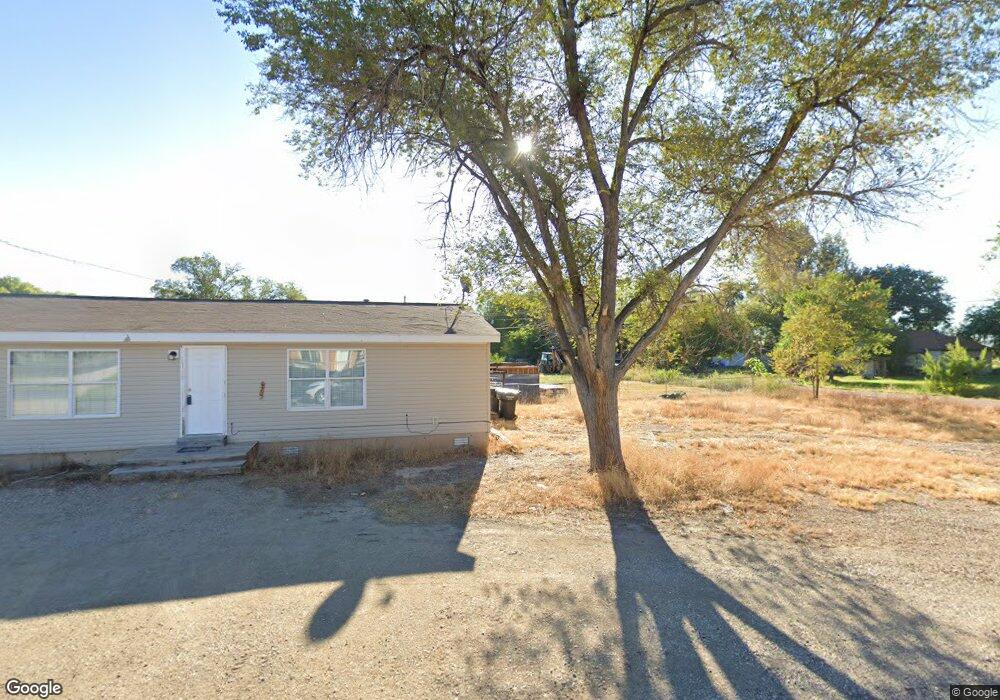
This home is located at 420 E Main St, Myton, UT 84052 and is currently estimated at $281,902, approximately $200 per square foot. 420 E Main St is a home located in Duchesne County with nearby schools including Myton School, Roosevelt Junior High School, and Union High School.
Ownership History
Date
Name
Owned For
Owner Type
Purchase Details
Closed on
Aug 11, 2022
Sold by
Echo Mountain Group Llc
Bought by
Mounga Mafi F
Current Estimated Value
Home Financials for this Owner
Home Financials are based on the most recent Mortgage that was taken out on this home.
Original Mortgage
$210,123
Outstanding Balance
$200,132
Interest Rate
5.22%
Mortgage Type
Construction
Estimated Equity
$81,770
Create a Home Valuation Report for This Property
The Home Valuation Report is an in-depth analysis detailing your home's value as well as a comparison with similar homes in the area
Purchase History
| Date | Buyer | Sale Price | Title Company |
|---|---|---|---|
| Mounga Mafi F | $212,224 | Express Title Ins Agcy Inc |
Source: Public Records
Mortgage History
| Date | Status | Borrower | Loan Amount |
|---|---|---|---|
| Open | Mounga Mafi F | $210,123 | |
| Closed | Mounga Mafi F | $8,405 |
Source: Public Records
Tax History
| Year | Tax Paid | Tax Assessment Tax Assessment Total Assessment is a certain percentage of the fair market value that is determined by local assessors to be the total taxable value of land and additions on the property. | Land | Improvement |
|---|---|---|---|---|
| 2025 | $2,561 | $216,862 | $26,775 | $190,087 |
| 2024 | $2,548 | $216,862 | $26,775 | $190,087 |
| 2023 | $2,548 | $208,587 | $18,500 | $190,087 |
| 2022 | $2,148 | $159,610 | $18,500 | $141,110 |
| 2021 | $1,750 | $113,581 | $15,000 | $98,581 |
| 2020 | $1,704 | $112,990 | $11,000 | $101,990 |
| 2019 | $1,683 | $112,990 | $11,000 | $101,990 |
| 2018 | $867 | $103,906 | $11,000 | $92,906 |
| 2017 | $819 | $0 | $0 | $0 |
| 2016 | $806 | $0 | $0 | $0 |
| 2015 | $928 | $0 | $0 | $0 |
| 2014 | $916 | $125,888 | $8,500 | $117,388 |
| 2013 | $863 | $115,216 | $8,500 | $106,716 |
Source: Public Records
Map
Nearby Homes
Your Personal Tour Guide
Ask me questions while you tour the home.