Estimated Value: $290,518 - $316,000
3
Beds
2
Baths
1,164
Sq Ft
$260/Sq Ft
Est. Value
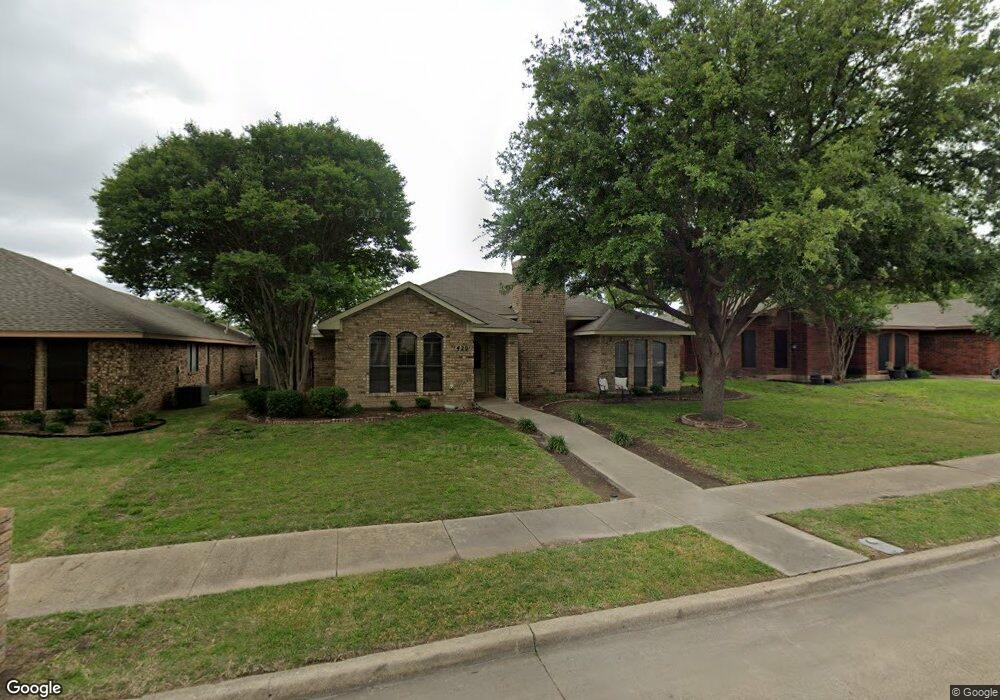
About This Home
This home is located at 420 Elliot St, Wylie, TX 75098 and is currently estimated at $302,630, approximately $259 per square foot. 420 Elliot St is a home located in Collin County with nearby schools including T.F. Birmingham Elementary School, Frank Mcmillan Junior High School, and Davis Intermediate School.
Ownership History
Date
Name
Owned For
Owner Type
Purchase Details
Closed on
Oct 21, 2004
Sold by
Chase Candy and Chase Todd A
Bought by
Anderson Jennifer F
Current Estimated Value
Home Financials for this Owner
Home Financials are based on the most recent Mortgage that was taken out on this home.
Original Mortgage
$82,800
Interest Rate
5.66%
Mortgage Type
Purchase Money Mortgage
Purchase Details
Closed on
May 6, 2003
Sold by
Smith Matt and Smith Brandi
Bought by
Chase Candy
Home Financials for this Owner
Home Financials are based on the most recent Mortgage that was taken out on this home.
Original Mortgage
$91,563
Interest Rate
5.77%
Mortgage Type
FHA
Purchase Details
Closed on
Jul 25, 1994
Sold by
Lewis David Wynn and Lewis Cathlyn Crook
Bought by
Smith Matt
Home Financials for this Owner
Home Financials are based on the most recent Mortgage that was taken out on this home.
Original Mortgage
$59,670
Interest Rate
8.3%
Mortgage Type
FHA
Create a Home Valuation Report for This Property
The Home Valuation Report is an in-depth analysis detailing your home's value as well as a comparison with similar homes in the area
Home Values in the Area
Average Home Value in this Area
Purchase History
| Date | Buyer | Sale Price | Title Company |
|---|---|---|---|
| Anderson Jennifer F | -- | -- | |
| Chase Candy | -- | -- | |
| Smith Matt | -- | -- |
Source: Public Records
Mortgage History
| Date | Status | Borrower | Loan Amount |
|---|---|---|---|
| Closed | Anderson Jennifer F | $82,800 | |
| Previous Owner | Chase Candy | $91,563 | |
| Previous Owner | Smith Matt | $59,670 |
Source: Public Records
Tax History Compared to Growth
Tax History
| Year | Tax Paid | Tax Assessment Tax Assessment Total Assessment is a certain percentage of the fair market value that is determined by local assessors to be the total taxable value of land and additions on the property. | Land | Improvement |
|---|---|---|---|---|
| 2025 | $5,094 | $282,258 | $90,000 | $192,258 |
| 2024 | $5,094 | $257,906 | $85,000 | $194,668 |
| 2023 | $5,094 | $214,922 | $85,000 | $129,922 |
| 2022 | $4,297 | $195,842 | $75,000 | $120,842 |
| 2021 | $3,722 | $158,205 | $60,000 | $98,205 |
| 2020 | $3,802 | $153,118 | $50,000 | $103,118 |
| 2019 | $4,007 | $152,500 | $50,000 | $102,500 |
| 2018 | $4,085 | $151,677 | $50,000 | $101,677 |
| 2017 | $3,763 | $139,742 | $50,000 | $89,742 |
| 2016 | $3,198 | $115,083 | $35,000 | $80,083 |
| 2015 | $2,429 | $98,000 | $30,000 | $68,000 |
Source: Public Records
Map
Nearby Homes
- 420 W Oak St
- 107 N Winding Oaks Dr
- 404 W Jefferson St
- 205 S Cottonbelt Ave
- 111 N Keefer Dr
- 300 S Cottonbelt Ave Unit 3A
- 307 W Brown St
- 310 Austin Ave
- 115 Pullman Place
- 314 Stephanie St
- 309 Sikorsky Ct
- 708 Andersonville Ln
- 315 Celia Cir
- 415 Carver Dr
- 410 N Winding Oaks Dr
- 303 N 2nd St
- 804 Memorial Dr
- 1022 Debby Ct
- 423 N Winding Oaks Dr
- 410 Oxford Dr