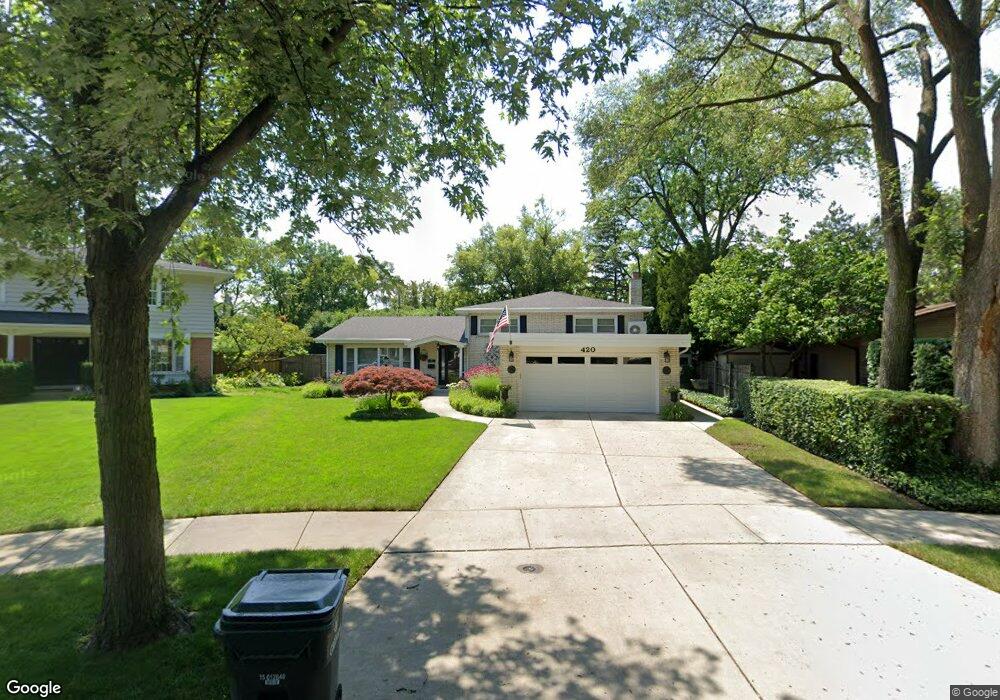
420 Elm St Glenview, IL 60025
Estimated Value: $630,000 - $794,000
4
Beds
3
Baths
1,785
Sq Ft
$406/Sq Ft
Est. Value
About This Home
This home is located at 420 Elm St, Glenview, IL 60025 and is currently estimated at $725,573, approximately $406 per square foot. 420 Elm St is a home located in Cook County with nearby schools including Hoffman Elementary School, Henking Elementary School, and Springman Middle School.
Ownership History
Date
Name
Owned For
Owner Type
Purchase Details
Closed on
Jul 3, 2024
Sold by
Larry R Farsakian Trust and Wendy S Farsakian Trust
Bought by
Wendy S Farsakian Trust and Farsakian
Current Estimated Value
Purchase Details
Closed on
Aug 12, 2017
Sold by
Farsakian Larry R and Farsakian Wendy S
Bought by
Farsakian Larry R and Larry R Farsakian Trust
Purchase Details
Closed on
Dec 21, 1998
Sold by
Lushbough Channing H and Lushbough Eloise T
Bought by
Farsakian Larry R and Farsakian Wendy S
Home Financials for this Owner
Home Financials are based on the most recent Mortgage that was taken out on this home.
Original Mortgage
$240,000
Interest Rate
7.02%
Purchase Details
Closed on
Mar 14, 1994
Sold by
Lushbough Eloise T and Lushbough Channing H
Bought by
Lushbough Channing H and Lushbough Eloise T
Home Financials for this Owner
Home Financials are based on the most recent Mortgage that was taken out on this home.
Original Mortgage
$200,000
Interest Rate
5.25%
Create a Home Valuation Report for This Property
The Home Valuation Report is an in-depth analysis detailing your home's value as well as a comparison with similar homes in the area
Home Values in the Area
Average Home Value in this Area
Purchase History
| Date | Buyer | Sale Price | Title Company |
|---|---|---|---|
| Wendy S Farsakian Trust | -- | Ticor Title | |
| Farsakian Larry R | -- | Attorney | |
| Farsakian Larry R | $315,000 | -- | |
| Lushbough Channing H | -- | -- |
Source: Public Records
Mortgage History
| Date | Status | Borrower | Loan Amount |
|---|---|---|---|
| Previous Owner | Farsakian Larry R | $240,000 | |
| Previous Owner | Lushbough Channing H | $200,000 |
Source: Public Records
Tax History Compared to Growth
Tax History
| Year | Tax Paid | Tax Assessment Tax Assessment Total Assessment is a certain percentage of the fair market value that is determined by local assessors to be the total taxable value of land and additions on the property. | Land | Improvement |
|---|---|---|---|---|
| 2024 | $8,363 | $43,548 | $8,348 | $35,200 |
| 2023 | $9,017 | $43,548 | $8,348 | $35,200 |
| 2022 | $9,017 | $47,838 | $8,348 | $39,490 |
| 2021 | $6,636 | $32,466 | $7,155 | $25,311 |
| 2020 | $8,584 | $38,012 | $7,155 | $30,857 |
| 2019 | $9,335 | $48,117 | $7,155 | $40,962 |
| 2018 | $8,139 | $38,518 | $6,161 | $32,357 |
| 2017 | $7,976 | $38,518 | $6,161 | $32,357 |
| 2016 | $7,733 | $38,518 | $6,161 | $32,357 |
| 2015 | $6,718 | $30,436 | $5,167 | $25,269 |
| 2014 | $6,604 | $30,436 | $5,167 | $25,269 |
| 2013 | $6,025 | $28,667 | $5,167 | $23,500 |
Source: Public Records
Map
Nearby Homes
- 517 Briarhill Ln
- 315 Lincoln St
- 1821 George Ct
- 245 Nora Ave
- 51 James Ct
- 137 Julie Dr
- 216 Flora Ave
- 7324 Palma Ln
- 2137 Glenview Rd
- 316 Nellie Ct
- 2700 Fontana Dr
- 203 Valerie Ct
- 2521 Gayle Ct
- 9523 Oconto Ave
- 601 Carriage Hill Dr
- 609 Carriage Hill Dr
- 1800 Dewes St Unit 305
- 1800 Dewes St Unit 201
- 1800 Dewes St Unit 309
- 7434 Emerson St