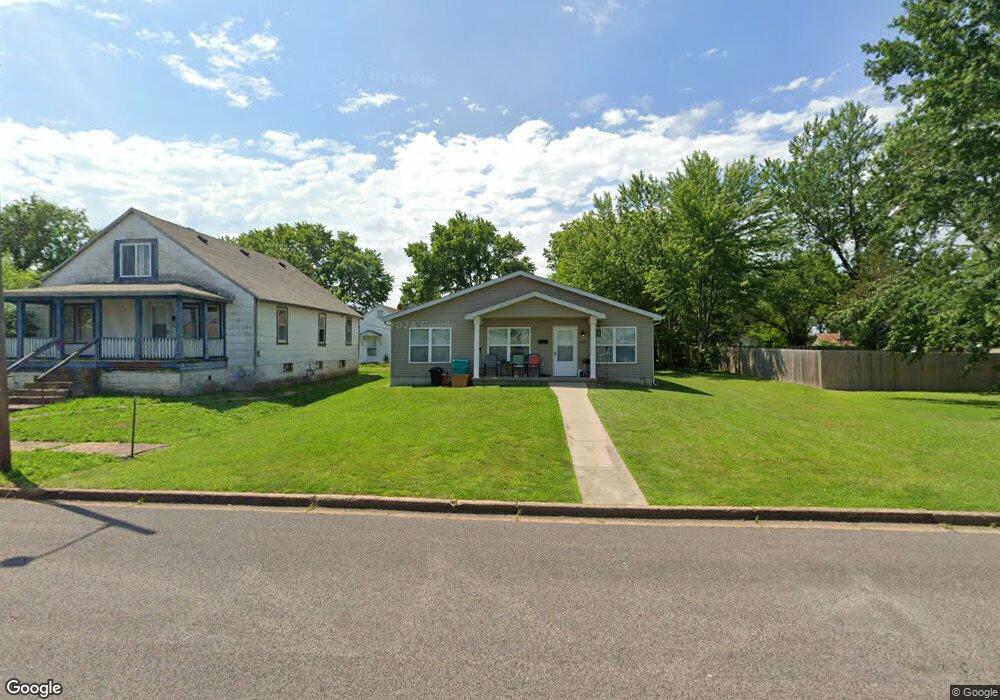
420 Elm St Unit 422 Sullivan, MO 63080
Estimated Value: $187,000 - $264,000
3
Beds
2
Baths
1,300
Sq Ft
$175/Sq Ft
Est. Value
About This Home
This home is located at 420 Elm St Unit 422, Sullivan, MO 63080 and is currently estimated at $226,924, approximately $174 per square foot. 420 Elm St Unit 422 is a home located in Franklin County with nearby schools including Sullivan Primary School, Sullivan Elementary School, and Sullivan Middle School.
Ownership History
Date
Name
Owned For
Owner Type
Purchase Details
Closed on
Dec 16, 2016
Sold by
Mcculloch Caren C
Bought by
Lori Pryor Johanning Real Estate
Current Estimated Value
Home Financials for this Owner
Home Financials are based on the most recent Mortgage that was taken out on this home.
Original Mortgage
$109,025
Outstanding Balance
$88,934
Interest Rate
3.94%
Mortgage Type
New Conventional
Estimated Equity
$137,990
Purchase Details
Closed on
Mar 29, 2006
Sold by
Roskowske Helen M and Roskowske Ronald D
Bought by
Cain Richard B and Cain Caren C
Create a Home Valuation Report for This Property
The Home Valuation Report is an in-depth analysis detailing your home's value as well as a comparison with similar homes in the area
Home Values in the Area
Average Home Value in this Area
Purchase History
| Date | Buyer | Sale Price | Title Company |
|---|---|---|---|
| Lori Pryor Johanning Real Estate | -- | -- | |
| Cain Richard B | -- | None Available |
Source: Public Records
Mortgage History
| Date | Status | Borrower | Loan Amount |
|---|---|---|---|
| Open | Lori Pryor Johanning Real Estate | $109,025 |
Source: Public Records
Tax History
| Year | Tax Paid | Tax Assessment Tax Assessment Total Assessment is a certain percentage of the fair market value that is determined by local assessors to be the total taxable value of land and additions on the property. | Land | Improvement |
|---|---|---|---|---|
| 2025 | $2,062 | $33,301 | $0 | $0 |
| 2024 | $2,062 | $30,372 | $0 | $0 |
| 2023 | $1,765 | $30,372 | $0 | $0 |
| 2022 | $1,975 | $34,058 | $0 | $0 |
| 2021 | $1,986 | $34,058 | $0 | $0 |
| 2020 | $1,815 | $30,535 | $0 | $0 |
| 2019 | $1,817 | $30,535 | $0 | $0 |
| 2018 | $1,737 | $28,819 | $0 | $0 |
| 2017 | $1,752 | $28,819 | $0 | $0 |
| 2016 | $1,581 | $26,304 | $0 | $0 |
| 2015 | $1,585 | $26,304 | $0 | $0 |
| 2014 | $1,550 | $26,558 | $0 | $0 |
Source: Public Records
Map
Nearby Homes
Your Personal Tour Guide
Ask me questions while you tour the home.