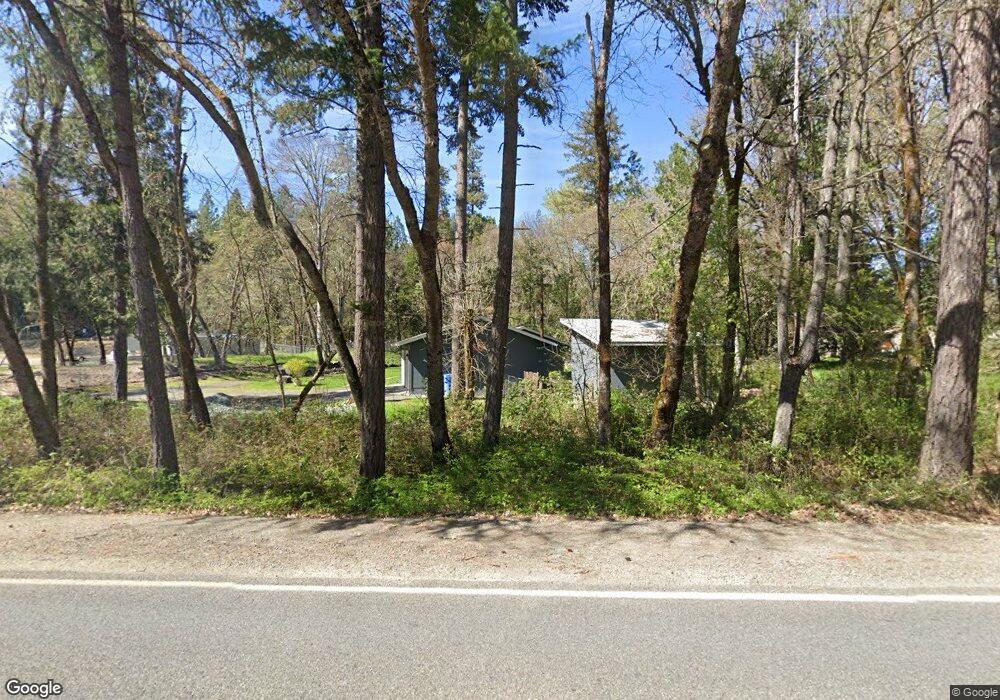
420 Fish Hatchery Rd Grants Pass, OR 97527
New Hope NeighborhoodEstimated Value: $402,866 - $458,000
4
Beds
2
Baths
1,668
Sq Ft
$258/Sq Ft
Est. Value
About This Home
This home is located at 420 Fish Hatchery Rd, Grants Pass, OR 97527 and is currently estimated at $430,433, approximately $258 per square foot. 420 Fish Hatchery Rd is a home located in Josephine County with nearby schools including Madrona Elementary School, Lincoln Savage Middle School, and Hidden Valley High School.
Ownership History
Date
Name
Owned For
Owner Type
Purchase Details
Closed on
Apr 28, 2017
Sold by
Gerling Laura D and Gerling Shawn A
Bought by
Gerling Shawn A and Gerling Laura D
Current Estimated Value
Purchase Details
Closed on
Aug 18, 2011
Sold by
Sofcu Community Credit Union
Bought by
Bowman Laura D and Gerling Shawn A
Home Financials for this Owner
Home Financials are based on the most recent Mortgage that was taken out on this home.
Original Mortgage
$114,000
Outstanding Balance
$78,503
Interest Rate
4.53%
Mortgage Type
Seller Take Back
Estimated Equity
$351,930
Purchase Details
Closed on
Apr 29, 2011
Sold by
Waterman Craig S
Bought by
Sofcu Community Credit Union
Purchase Details
Closed on
Mar 24, 2011
Sold by
Nottingham Steven M
Bought by
Nottingham Steven M and The Steven M Nottingham Family Trust
Create a Home Valuation Report for This Property
The Home Valuation Report is an in-depth analysis detailing your home's value as well as a comparison with similar homes in the area
Home Values in the Area
Average Home Value in this Area
Purchase History
| Date | Buyer | Sale Price | Title Company |
|---|---|---|---|
| Gerling Shawn A | -- | None Available | |
| Bowman Laura D | $120,000 | Ticor Title Company Oregon | |
| Sofcu Community Credit Union | $239,755 | Fa | |
| Nottingham Steven M | -- | None Available |
Source: Public Records
Mortgage History
| Date | Status | Borrower | Loan Amount |
|---|---|---|---|
| Open | Bowman Laura D | $114,000 |
Source: Public Records
Tax History Compared to Growth
Tax History
| Year | Tax Paid | Tax Assessment Tax Assessment Total Assessment is a certain percentage of the fair market value that is determined by local assessors to be the total taxable value of land and additions on the property. | Land | Improvement |
|---|---|---|---|---|
| 2025 | $1,632 | $222,350 | -- | -- |
| 2024 | $1,632 | $215,880 | -- | -- |
| 2023 | $1,379 | $209,600 | $0 | $0 |
| 2022 | $1,352 | $203,500 | -- | -- |
| 2021 | $1,268 | $197,580 | $0 | $0 |
| 2020 | $1,321 | $191,830 | $0 | $0 |
| 2019 | $1,269 | $186,250 | $0 | $0 |
| 2018 | $1,288 | $180,830 | $0 | $0 |
| 2017 | $1,287 | $175,570 | $0 | $0 |
| 2016 | $1,095 | $170,460 | $0 | $0 |
| 2015 | $1,058 | $165,500 | $0 | $0 |
| 2014 | $1,032 | $160,680 | $0 | $0 |
Source: Public Records
Map
Nearby Homes
- 163 Genverna Glen
- 500 Cumberland Dr
- 469 Detrick Dr
- 5181 New Hope Rd
- 550 Bolt Mountain Rd
- 543 Hidden Valley Rd
- 697 Jaynes Dr
- 785 Keen Rd
- 703 Jaynes Dr
- 219 Pearl Dr
- 442 Honeylynn Ln
- 548 Moonbeam Ln
- 7342 New Hope Rd
- 280 Naturescape Rd
- 1833 Stringer Gap Rd
- 300 Work Ln
- 1940 Southside Rd
- 4810 Williams Hwy
- 240 Homewood Rd
- 5118 Williams Hwy
- 190 Genverna Glen
- 400 Fish Hatchery Rd
- 212 Genverna Glen
- 450 Fish Hatchery Rd
- 174 Genverna Glen
- 252 Genverna Glen
- 375 Fish Hatchery Rd
- 160 Himrich Dr
- 555 Fish Hatchery Rd
- 185 Genverna Glen
- 560 Fish Hatch
- 270 Genverna Glen
- 381 Himrich Dr
- 350 Fish Hatchery Rd
- 273 Genverna Glen
- 556 Fish Hatchery Rd
- 560 Fish Hatchery Rd
- 297 Genverna Glen
- 145 Himrich Dr
- 316 Genverna Glen