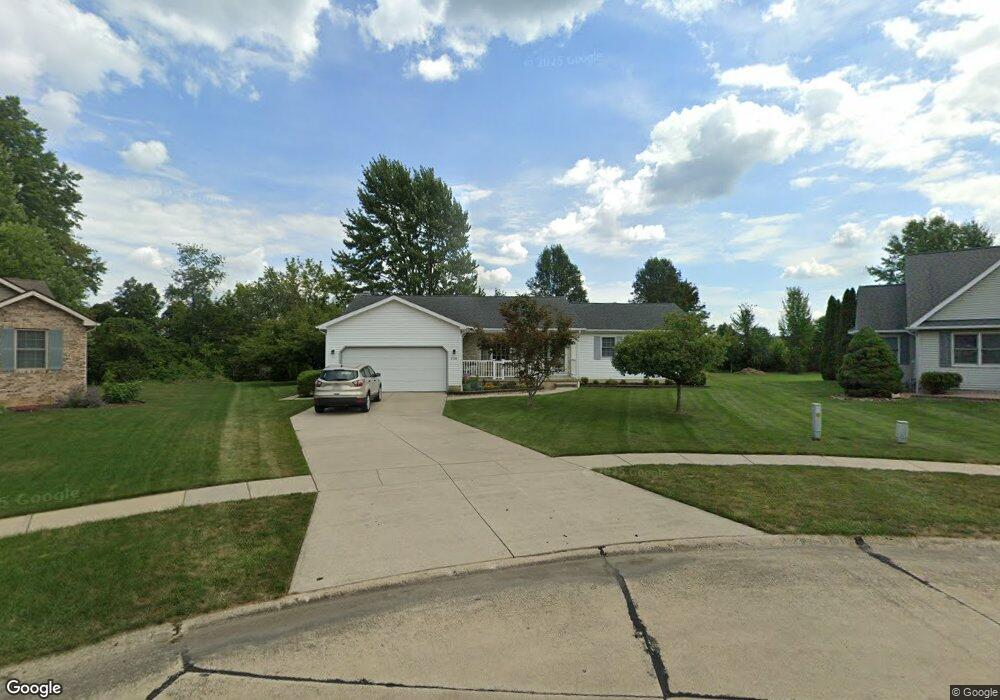
420 Forest St Lagrange, OH 44050
Estimated Value: $319,959 - $358,000
3
Beds
3
Baths
1,652
Sq Ft
$202/Sq Ft
Est. Value
About This Home
This home is located at 420 Forest St, Lagrange, OH 44050 and is currently estimated at $334,490, approximately $202 per square foot. 420 Forest St is a home located in Lorain County with nearby schools including Keystone Elementary School, Keystone Middle School, and Keystone High School.
Ownership History
Date
Name
Owned For
Owner Type
Purchase Details
Closed on
Mar 8, 2007
Sold by
Carrell Nancy Jo
Bought by
Davidson Daniel L and Davidson Gail E
Current Estimated Value
Home Financials for this Owner
Home Financials are based on the most recent Mortgage that was taken out on this home.
Original Mortgage
$125,600
Outstanding Balance
$76,107
Interest Rate
6.28%
Mortgage Type
Purchase Money Mortgage
Estimated Equity
$258,383
Purchase Details
Closed on
Oct 23, 2001
Sold by
Carrell Nancy J
Bought by
Carrell Nancy Jo and The Nancy Jo Carrell Living Trust
Purchase Details
Closed on
Feb 9, 2000
Sold by
Hamer Blake J and Hamer Joanne L
Bought by
Carrell Donald P and Carrell Nancy J
Home Financials for this Owner
Home Financials are based on the most recent Mortgage that was taken out on this home.
Original Mortgage
$62,000
Interest Rate
8.08%
Purchase Details
Closed on
Feb 6, 1997
Sold by
Mccumbers Galry
Bought by
Hammer Blake J and Hammer Joanne L
Create a Home Valuation Report for This Property
The Home Valuation Report is an in-depth analysis detailing your home's value as well as a comparison with similar homes in the area
Home Values in the Area
Average Home Value in this Area
Purchase History
| Date | Buyer | Sale Price | Title Company |
|---|---|---|---|
| Davidson Daniel L | $157,000 | Lawyers Title Ins | |
| Carrell Nancy Jo | -- | -- | |
| Carrell Donald P | $165,000 | Midland Title | |
| Hammer Blake J | $137,800 | -- |
Source: Public Records
Mortgage History
| Date | Status | Borrower | Loan Amount |
|---|---|---|---|
| Open | Davidson Daniel L | $125,600 | |
| Previous Owner | Carrell Donald P | $62,000 |
Source: Public Records
Tax History
| Year | Tax Paid | Tax Assessment Tax Assessment Total Assessment is a certain percentage of the fair market value that is determined by local assessors to be the total taxable value of land and additions on the property. | Land | Improvement |
|---|---|---|---|---|
| 2024 | $4,147 | $97,853 | $14,963 | $82,891 |
| 2023 | $3,446 | $67,911 | $13,846 | $54,065 |
| 2022 | $3,423 | $67,911 | $13,846 | $54,065 |
| 2021 | $3,425 | $67,911 | $13,846 | $54,065 |
| 2020 | $3,345 | $59,100 | $12,050 | $47,050 |
| 2019 | $3,326 | $59,100 | $12,050 | $47,050 |
| 2018 | $3,209 | $59,100 | $12,050 | $47,050 |
| 2017 | $3,246 | $55,960 | $10,870 | $45,090 |
| 2016 | $3,225 | $55,960 | $10,870 | $45,090 |
| 2015 | $3,220 | $55,960 | $10,870 | $45,090 |
| 2014 | $2,800 | $55,140 | $10,710 | $44,430 |
| 2013 | $2,716 | $55,140 | $10,710 | $44,430 |
Source: Public Records
Map
Nearby Homes
- 608 Rundle St
- 548 William St
- 516 Appomattox Ct
- 700 Hayes St
- 17327 Wheeler Rd
- 801 Willich Ct
- 800 Buckingham Dr
- 808 Buckingham Dr
- 613 U s Grant St
- 336 Granger Dr
- 110 Railroad St
- 305 W Main St
- 40260 Whitney Rd
- 18022 State Route 301
- 0 Whitehead Rd
- 17058 Chamberlain Rd
- 14768 Whitehead Rd
- 39112 Parsons Rd
- 40175 Banks Rd
- 40163 Banks Rd
- 424 Forest St
- 416 Forest St
- 419 Forest St
- 412 Forest St
- 181 Parklane Dr
- 415 Forest St
- 411 Forest St
- 404 Forest St
- 322 Hendrix Blvd
- 318 Hendrix Blvd
- 326 Hendrix Blvd
- 314 Hendrix Blvd
- 401 Forest St
- 330 Hendrix Blvd
- 310 Hendrix Blvd
- 436 Hendrix Blvd
- 306 Hendrix Blvd
- 349 Forest St
- 400 Forest St
- 302 Hendrix Blvd
Your Personal Tour Guide
Ask me questions while you tour the home.