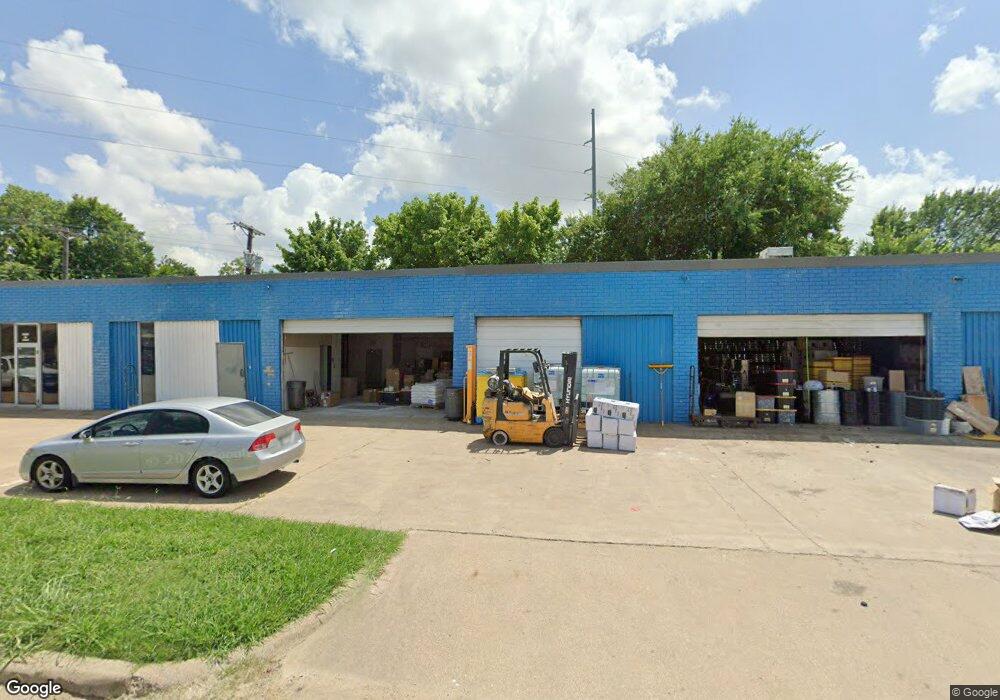
420 Gautney St Unit 200 Garland, TX 75040
Terrace Bellaire NeighborhoodEstimated Value: $323,322
--
Bed
--
Bath
6,400
Sq Ft
$51/Sq Ft
Est. Value
About This Home
This home is located at 420 Gautney St Unit 200, Garland, TX 75040 and is currently priced at $323,322, approximately $50 per square foot. 420 Gautney St Unit 200 is a home located in Dallas County with nearby schools including Garland Christian Academy, Mount Hebron Christian Academy, and Good Shepherd Catholic School.
Ownership History
Date
Name
Owned For
Owner Type
Purchase Details
Closed on
Dec 20, 2022
Sold by
Neher Matt
Bought by
Neher Holdings Llc
Current Estimated Value
Purchase Details
Closed on
Mar 12, 2007
Sold by
Spyres Deborah Kay
Bought by
Spyres Deborah Kay
Purchase Details
Closed on
Jan 22, 2007
Sold by
Estes Patsy
Bought by
Spyres Deborah and Harold E Williams Revocable Living Trust
Create a Home Valuation Report for This Property
The Home Valuation Report is an in-depth analysis detailing your home's value as well as a comparison with similar homes in the area
Home Values in the Area
Average Home Value in this Area
Purchase History
| Date | Buyer | Sale Price | Title Company |
|---|---|---|---|
| Neher Holdings Llc | -- | -- | |
| Spyres Deborah Kay | -- | None Available | |
| Spyres Deborah | -- | None Available |
Source: Public Records
Tax History Compared to Growth
Tax History
| Year | Tax Paid | Tax Assessment Tax Assessment Total Assessment is a certain percentage of the fair market value that is determined by local assessors to be the total taxable value of land and additions on the property. | Land | Improvement |
|---|---|---|---|---|
| 2025 | $7,076 | $630,520 | $140,000 | $490,520 |
| 2024 | $7,076 | $457,130 | $84,000 | $373,130 |
| 2023 | $5,934 | $259,350 | $84,000 | $175,350 |
| 2022 | $5,651 | $229,830 | $84,000 | $145,830 |
| 2021 | $6,044 | $229,830 | $84,000 | $145,830 |
| 2020 | $5,801 | $217,600 | $84,000 | $133,600 |
| 2019 | $6,139 | $217,600 | $84,000 | $133,600 |
| 2018 | $4,585 | $162,510 | $84,000 | $78,510 |
| 2017 | $4,582 | $162,510 | $84,000 | $78,510 |
| 2016 | $4,025 | $142,780 | $84,000 | $58,780 |
| 2015 | $3,743 | $142,780 | $84,000 | $58,780 |
| 2014 | $3,743 | $142,780 | $84,000 | $58,780 |
Source: Public Records
Map
Nearby Homes
- 714 Shorecrest Dr
- 507 Parker Cir
- 210 W Avenue A
- 213 Brackett St
- 818 Rosewood Hills Dr
- 813 Rosewood Hills Dr
- 1017 Peace Rose Ave
- 612 Henderson Cir
- 913 Rosewood Hills Dr
- 501 Henderson Cir
- 701 Davidson Dr
- 430 Davidson Dr
- 1209 Shorecrest Dr
- 1209 Bay Shore Dr
- 717 Eastern Star Dr
- 1033 Glynn Dr
- 801 Quebec Dr
- 805 Ontario Dr
- 525 Moonlight Dr
- 522 Milky Way
- 420 Gautney St Unit 400
- 420 Gautney St
- 250 78 Dr
- 250 Lavon Dr
- 238 Lavon Dr
- 225 Commercial St
- 226 Garvon St
- 224 Garvon St Unit B
- 224B Garvon St
- 222 Garvon St
- 301 Lavon Dr
- 213 Commercial St
- 214 Commercial St
- 218 Garvon St
- 209 Commercial St
- 216 Garvon St
- 506 Shorecrest Dr
- 504 Shorecrest Dr
- 508 Shorecrest Dr
- 702 E Walnut Cir Unit B