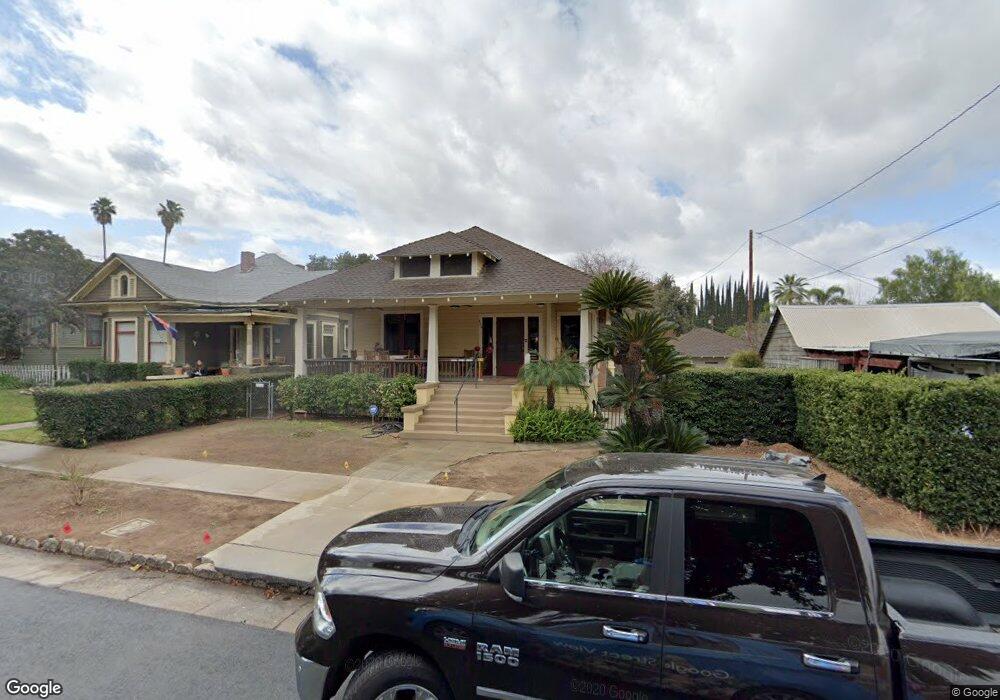
420 Grant St Redlands, CA 92373
South Redlands NeighborhoodEstimated Value: $615,295 - $654,000
3
Beds
2
Baths
1,641
Sq Ft
$385/Sq Ft
Est. Value
About This Home
This home is located at 420 Grant St, Redlands, CA 92373 and is currently estimated at $632,324, approximately $385 per square foot. 420 Grant St is a home located in San Bernardino County with nearby schools including Kingsbury Elementary School, Cope Middle School, and Redlands Senior High School.
Ownership History
Date
Name
Owned For
Owner Type
Purchase Details
Closed on
Aug 10, 2020
Sold by
Tellez Norbert and Bivona Tellez Christina
Bought by
Tellez Norbert and Bivona Tellez Christina
Current Estimated Value
Purchase Details
Closed on
Mar 20, 1998
Sold by
Bivona Christina and Bivona Christina M
Bought by
Tellez Norbert and Bivona Tellez Christina M
Home Financials for this Owner
Home Financials are based on the most recent Mortgage that was taken out on this home.
Original Mortgage
$131,000
Interest Rate
7.06%
Create a Home Valuation Report for This Property
The Home Valuation Report is an in-depth analysis detailing your home's value as well as a comparison with similar homes in the area
Home Values in the Area
Average Home Value in this Area
Purchase History
| Date | Buyer | Sale Price | Title Company |
|---|---|---|---|
| Tellez Norbert | -- | None Available | |
| Tellez Norbert | -- | Old Republic Title |
Source: Public Records
Mortgage History
| Date | Status | Borrower | Loan Amount |
|---|---|---|---|
| Closed | Tellez Norbert | $131,000 |
Source: Public Records
Tax History
| Year | Tax Paid | Tax Assessment Tax Assessment Total Assessment is a certain percentage of the fair market value that is determined by local assessors to be the total taxable value of land and additions on the property. | Land | Improvement |
|---|---|---|---|---|
| 2025 | $3,550 | $290,903 | $72,151 | $218,752 |
| 2024 | $3,314 | $285,199 | $70,736 | $214,463 |
| 2023 | $3,308 | $279,607 | $69,349 | $210,258 |
| 2022 | $3,259 | $274,124 | $67,989 | $206,135 |
| 2021 | $3,316 | $268,749 | $66,656 | $202,093 |
| 2020 | $3,266 | $265,994 | $65,973 | $200,021 |
| 2019 | $3,174 | $260,778 | $64,679 | $196,099 |
| 2018 | $3,093 | $255,665 | $63,411 | $192,254 |
| 2017 | $3,066 | $250,652 | $62,168 | $188,484 |
| 2016 | $3,030 | $245,737 | $60,949 | $184,788 |
| 2015 | $3,006 | $242,045 | $60,033 | $182,012 |
| 2014 | $2,950 | $237,304 | $58,857 | $178,447 |
Source: Public Records
Map
Nearby Homes
- 509 S 4th St
- 424 La Verne St
- 421 La Verne St
- 416 Sonora Cir
- 622 Esther Way
- 434 Sonora Cir
- 135 E Cypress Ave
- 521 Bond St
- 302 Sonora St
- 643 Cypress Cir
- 211 E Olive Ave
- 0 W Palm Ave Unit IV25244005
- 246 E Fern Ave Unit 205
- 246 E Fern Ave Unit 109
- 254 E Fern Ave Unit 212
- 527 W Palm Ave
- 520 Linda Place
- 608 Linda Place
- 1029 W Clifton Ave
- 0 0 Unit IG26066829
Your Personal Tour Guide
Ask me questions while you tour the home.