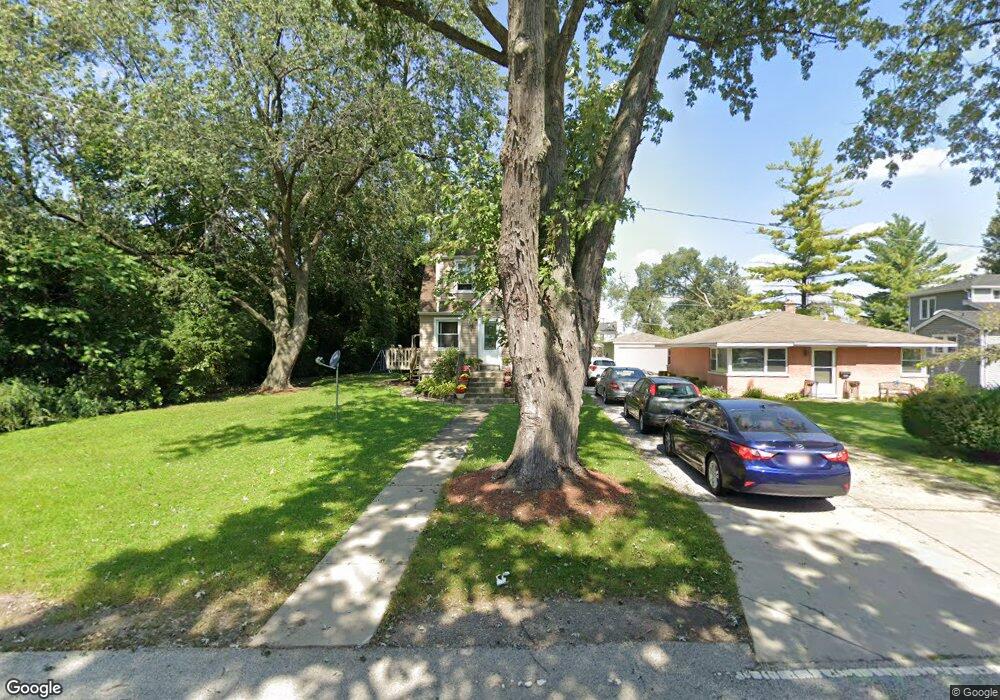
420 Harvey Ave Des Plaines, IL 60016
Estimated Value: $289,000 - $351,774
2
Beds
2
Baths
1,062
Sq Ft
$299/Sq Ft
Est. Value
About This Home
This home is located at 420 Harvey Ave, Des Plaines, IL 60016 and is currently estimated at $317,258, approximately $298 per square foot. 420 Harvey Ave is a home located in Cook County with nearby schools including Terrace Elementary School, Chippewa Middle School, and Maine West High School.
Ownership History
Date
Name
Owned For
Owner Type
Purchase Details
Closed on
Oct 21, 2009
Sold by
Nationstar Mortgage Llc
Bought by
Zegarski Joanna
Current Estimated Value
Purchase Details
Closed on
Apr 20, 2009
Sold by
Fi0ne Jacob L and Fine Jake
Bought by
Nationstar Mortgage Llc
Purchase Details
Closed on
Oct 1, 2004
Sold by
Hansen Patricia H
Bought by
Fine Jake
Home Financials for this Owner
Home Financials are based on the most recent Mortgage that was taken out on this home.
Original Mortgage
$174,000
Interest Rate
7.37%
Mortgage Type
Unknown
Purchase Details
Closed on
Jul 5, 1991
Sold by
Hansen Harvey J
Bought by
Hansen Patricia H
Home Financials for this Owner
Home Financials are based on the most recent Mortgage that was taken out on this home.
Original Mortgage
$50,900
Interest Rate
7.36%
Create a Home Valuation Report for This Property
The Home Valuation Report is an in-depth analysis detailing your home's value as well as a comparison with similar homes in the area
Home Values in the Area
Average Home Value in this Area
Purchase History
| Date | Buyer | Sale Price | Title Company |
|---|---|---|---|
| Zegarski Joanna | $87,500 | Forum Title Insurance Co | |
| Nationstar Mortgage Llc | -- | None Available | |
| Fine Jake | $217,500 | Bell Title Corporation | |
| Hansen Patricia H | -- | -- |
Source: Public Records
Mortgage History
| Date | Status | Borrower | Loan Amount |
|---|---|---|---|
| Previous Owner | Fine Jake | $174,000 | |
| Previous Owner | Hansen Patricia H | $50,900 |
Source: Public Records
Tax History Compared to Growth
Tax History
| Year | Tax Paid | Tax Assessment Tax Assessment Total Assessment is a certain percentage of the fair market value that is determined by local assessors to be the total taxable value of land and additions on the property. | Land | Improvement |
|---|---|---|---|---|
| 2024 | $5,669 | $21,501 | $7,856 | $13,645 |
| 2023 | $5,532 | $21,501 | $7,856 | $13,645 |
| 2022 | $5,532 | $21,501 | $7,856 | $13,645 |
| 2021 | $5,664 | $18,427 | $6,285 | $12,142 |
| 2020 | $5,569 | $18,427 | $6,285 | $12,142 |
| 2019 | $5,510 | $20,475 | $6,285 | $14,190 |
| 2018 | $6,215 | $20,781 | $5,499 | $15,282 |
| 2017 | $6,105 | $20,781 | $5,499 | $15,282 |
| 2016 | $5,775 | $20,781 | $5,499 | $15,282 |
| 2015 | $6,226 | $20,596 | $4,713 | $15,883 |
| 2014 | $6,095 | $20,596 | $4,713 | $15,883 |
| 2013 | $5,943 | $20,596 | $4,713 | $15,883 |
Source: Public Records
Map
Nearby Homes
- 332 S Cumberland Pkwy
- 220 E Washington St
- 154 Cornell Ave
- 52 N 6th Ave
- 760 Hanbury Dr Unit 65
- 758 Hanbury Dr Unit 66
- 47 S Josephine Ct
- 511 Bedford Ln
- 39 N 5th Ave
- 21 W Bradley St
- 805 North Ave
- 633 S George St
- 450 Little Path Rd
- 890 North Ave
- 304 Amherst Ave
- 110 Westmere Rd
- 955 Rand Rd
- 224 W Bradley St
- 1000 E Lincoln St
- 191 W Millers Rd
- 426 Harvey Ave
- 436 Harvey Ave
- 224 S Wolf Rd
- 216 S Wolf Rd
- 210 S Wolf Rd
- 427 E Golf Rd
- 413 Harvey Ave
- 433 E Golf Rd
- 435 Harvey Ave
- 443 Harvey Ave
- 427 Harvey Ave
- 451 Harvey Ave
- 419 E Golf Rd
- 227 S Warrington Rd
- 473 Harvey Ave Unit 55
- 387 E Golf Rd
- 241 S Warrington Rd
- 124 S Wolf Rd
- 249 S Warrington Rd
- 114 S Wolf Rd