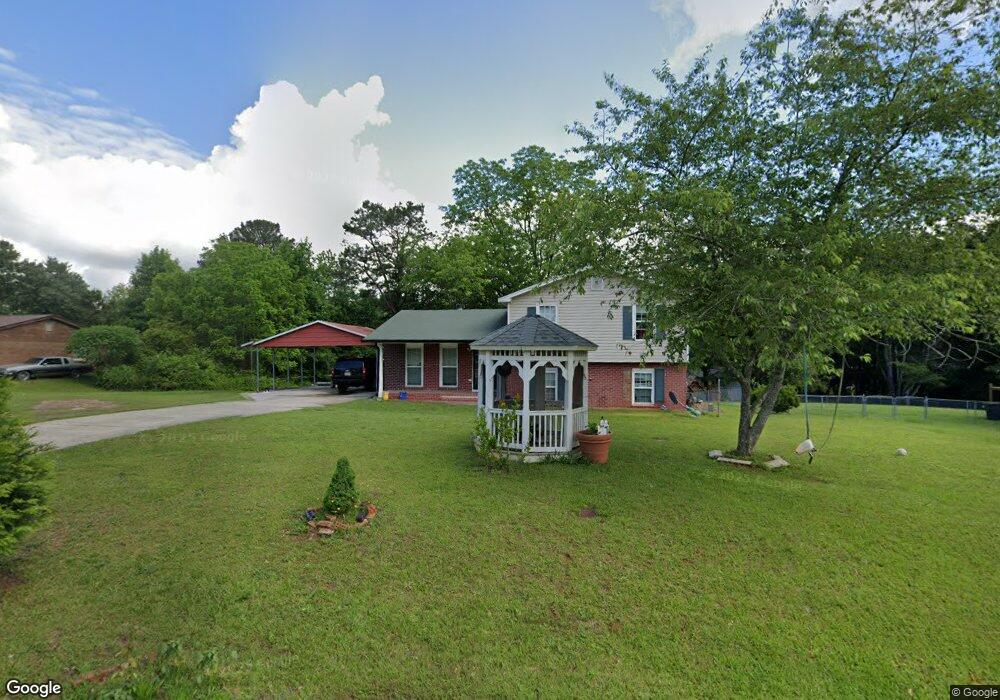
420 Henson Cir Carrollton, GA 30117
Abilene NeighborhoodEstimated Value: $228,899 - $244,000
3
Beds
2
Baths
2,630
Sq Ft
$91/Sq Ft
Est. Value
About This Home
This home is located at 420 Henson Cir, Carrollton, GA 30117 and is currently estimated at $238,975, approximately $90 per square foot. 420 Henson Cir is a home located in Carroll County with nearby schools including Sharp Creek Elementary School, Central Middle School, and Central High School.
Ownership History
Date
Name
Owned For
Owner Type
Purchase Details
Closed on
Sep 9, 2021
Sold by
Medrano Frediz
Bought by
Guzman Denia Maritza Iscoa
Current Estimated Value
Purchase Details
Closed on
Feb 20, 2018
Sold by
Izaguirre Fredy
Bought by
Frediz Medrano and Guzman Denia Maritza Iscoa
Purchase Details
Closed on
Oct 22, 2010
Sold by
Charterbank
Bought by
Izaguirre Fredy
Purchase Details
Closed on
Aug 9, 2010
Sold by
Mcintosh Comm Bk By Fdic
Bought by
Charterbank
Purchase Details
Closed on
Mar 29, 2010
Sold by
Mcintosh Commercial Bank
Bought by
Charterbank
Purchase Details
Closed on
Oct 2, 2007
Sold by
Jones Kelvin L
Bought by
Mcintosh Commercial Bank
Purchase Details
Closed on
Mar 8, 2004
Sold by
Gibbs Dan
Bought by
Jones Kelvin L
Purchase Details
Closed on
Feb 3, 2004
Sold by
Lumpkin Earnest and Lumpkin Mi
Bought by
Gibbs Dan
Purchase Details
Closed on
Oct 2, 1998
Sold by
Lumpkin
Bought by
Lumpkin Earnest and Lumpkin Mi
Purchase Details
Closed on
Sep 12, 1983
Bought by
Lumpkin
Create a Home Valuation Report for This Property
The Home Valuation Report is an in-depth analysis detailing your home's value as well as a comparison with similar homes in the area
Home Values in the Area
Average Home Value in this Area
Purchase History
| Date | Buyer | Sale Price | Title Company |
|---|---|---|---|
| Guzman Denia Maritza Iscoa | -- | -- | |
| Frediz Medrano | -- | -- | |
| Izaguirre Fredy | $20,000 | -- | |
| Charterbank | -- | -- | |
| Charterbank | -- | -- | |
| Charterbank | -- | -- | |
| Mcintosh Commercial Bank | -- | -- | |
| Jones Kelvin L | $70,500 | -- | |
| Gibbs Dan | -- | -- | |
| Lumpkin Earnest | -- | -- | |
| Lumpkin | -- | -- |
Source: Public Records
Tax History Compared to Growth
Tax History
| Year | Tax Paid | Tax Assessment Tax Assessment Total Assessment is a certain percentage of the fair market value that is determined by local assessors to be the total taxable value of land and additions on the property. | Land | Improvement |
|---|---|---|---|---|
| 2024 | $1,819 | $80,428 | $4,000 | $76,428 |
| 2023 | $1,819 | $73,497 | $4,000 | $69,497 |
| 2022 | $1,500 | $59,820 | $4,000 | $55,820 |
| 2021 | $1,329 | $51,855 | $4,000 | $47,855 |
| 2020 | $1,184 | $46,118 | $4,000 | $42,118 |
| 2019 | $1,101 | $42,559 | $4,000 | $38,559 |
| 2018 | $988 | $37,638 | $4,000 | $33,638 |
| 2017 | $1,029 | $39,052 | $4,000 | $35,052 |
| 2016 | $1,029 | $39,052 | $4,000 | $35,052 |
| 2015 | $412 | $14,724 | $4,000 | $10,724 |
| 2014 | $413 | $14,724 | $4,000 | $10,724 |
Source: Public Records
Map
Nearby Homes
- 345 Henson Cir
- 0 Henson Cir Unit 10584639
- 0 Henson Cir Unit 7632920
- 70 Henson Cir
- 219 Candlewood Dr
- 85 Mary Ln
- 114 Kyle Way
- 125 Springwood Dr
- 300 Georgia 113
- 524 Old Bremen Rd
- 110 Sharp Dr
- 70 W Meadowcliff Cir
- 281 Northwinds Blvd
- 281 Northwinds Blvd Unit B3
- 281 Northwinds Blvd Unit D3
- 0 Center Point Rd Unit TR 3 10274074
- 0 Center Point Rd Unit 7361099
- 101 Deer Park
- 45 Buell Jones Rd
- 2464 N 27 Highway & Bagwell Rd
- 430 Henson Cir
- 230 Henson Cir
- 400 Henson Cir
- 440 Henson Cir
- 220 Henson Cir
- 242 Henson Cir
- 415 Henson Cir
- 425 Henson Cir
- 262 Henson Cir
- 435 Henson Cir
- 390 Henson Cir
- 395 Henson Cir
- 445 Henson Cir
- 270 Henson Cir
- 345 W Barbara Ln
- 335 W Barbara Ln
- 380 Henson Cir
- 385 Henson Cir
- 245 Henson Cir
- 355 W Barbara Ln