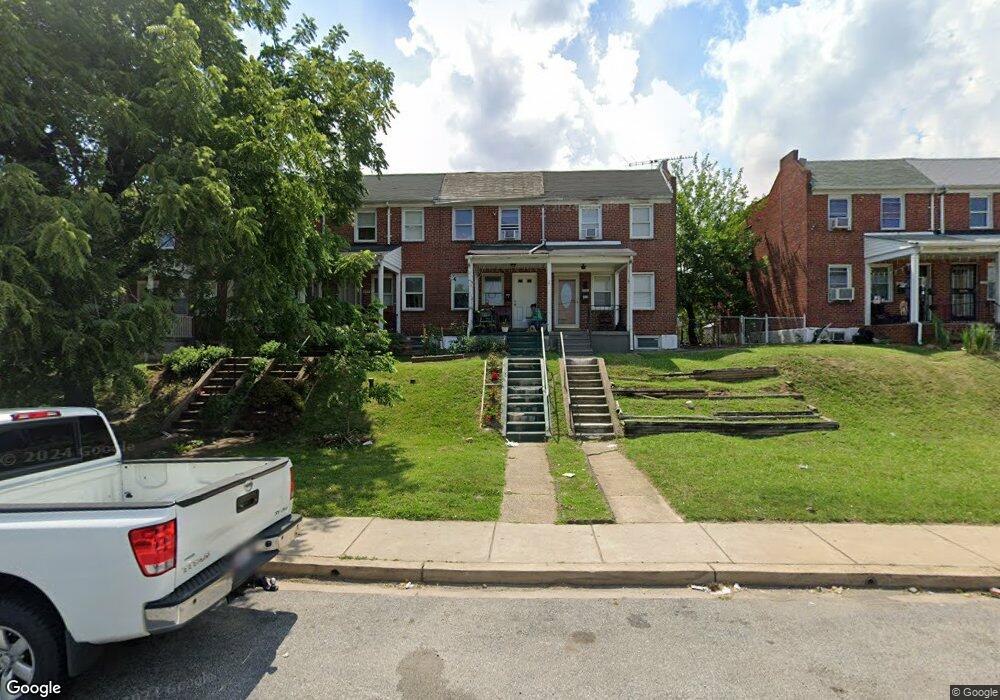
420 Kane St Baltimore, MD 21224
Estimated Value: $130,388 - $160,000
Studio
1
Bath
840
Sq Ft
$173/Sq Ft
Est. Value
About This Home
This home is located at 420 Kane St, Baltimore, MD 21224 and is currently estimated at $145,194, approximately $172 per square foot. 420 Kane St is a home located in Baltimore City with nearby schools including Graceland Park-O'Donnell Heights Elementary/Middle School, Booker T. Washington Middle School, and Patterson High School.
Ownership History
Date
Name
Owned For
Owner Type
Purchase Details
Closed on
May 3, 2012
Sold by
Jeffco Holdings Llc
Bought by
Harris Jeffrey
Current Estimated Value
Purchase Details
Closed on
Oct 3, 2005
Sold by
Hurt Mark A
Bought by
Jeffco Holdings Llc
Purchase Details
Closed on
Sep 20, 1994
Sold by
Mcdonough John W
Bought by
Hurt Mark A
Home Financials for this Owner
Home Financials are based on the most recent Mortgage that was taken out on this home.
Original Mortgage
$52,950
Interest Rate
8.38%
Create a Home Valuation Report for This Property
The Home Valuation Report is an in-depth analysis detailing your home's value as well as a comparison with similar homes in the area
Purchase History
| Date | Buyer | Sale Price | Title Company |
|---|---|---|---|
| Harris Jeffrey | $52,000 | -- | |
| Jeffco Holdings Llc | $112,500 | -- | |
| Hurt Mark A | $53,000 | -- |
Source: Public Records
Mortgage History
| Date | Status | Borrower | Loan Amount |
|---|---|---|---|
| Previous Owner | Hurt Mark A | $52,950 |
Source: Public Records
Tax History
| Year | Tax Paid | Tax Assessment Tax Assessment Total Assessment is a certain percentage of the fair market value that is determined by local assessors to be the total taxable value of land and additions on the property. | Land | Improvement |
|---|---|---|---|---|
| 2025 | $1,174 | $50,000 | $25,000 | $25,000 |
| 2024 | $1,174 | $50,000 | $25,000 | $25,000 |
| 2023 | $1,174 | $50,000 | $25,000 | $25,000 |
| 2022 | $1,180 | $50,000 | $25,000 | $25,000 |
| 2021 | $1,180 | $50,000 | $25,000 | $25,000 |
| 2020 | $1,180 | $50,000 | $25,000 | $25,000 |
| 2019 | $1,174 | $50,000 | $25,000 | $25,000 |
| 2018 | $1,180 | $50,000 | $25,000 | $25,000 |
| 2017 | $1,180 | $50,000 | $0 | $0 |
| 2016 | $1,540 | $50,000 | $0 | $0 |
| 2015 | $1,540 | $49,000 | $0 | $0 |
| 2014 | $1,540 | $61,333 | $0 | $0 |
Source: Public Records
Map
Nearby Homes
Your Personal Tour Guide
Ask me questions while you tour the home.