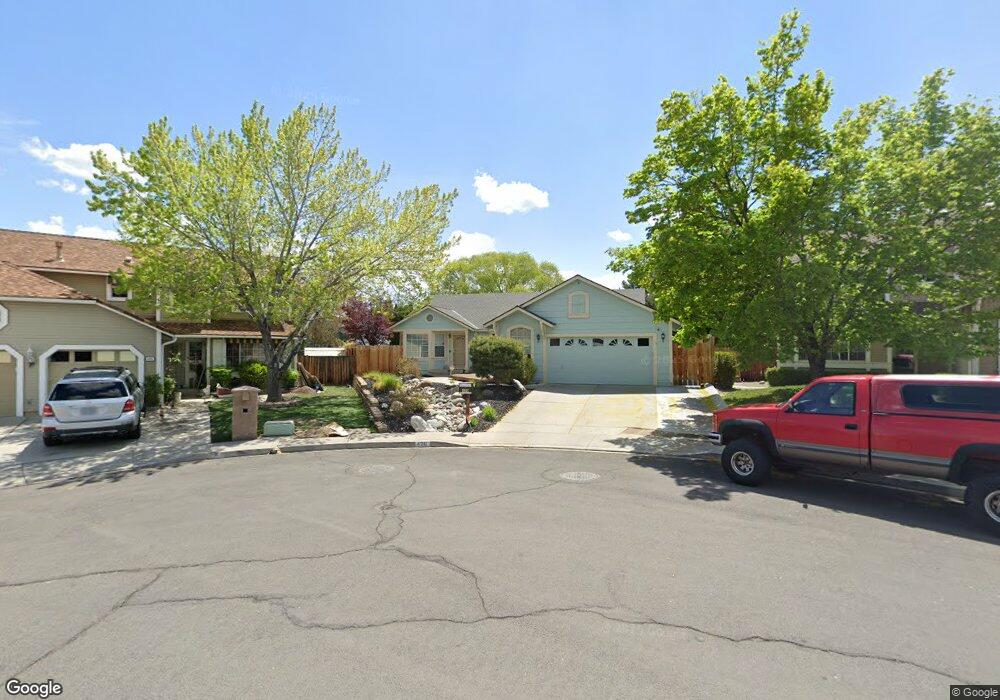
420 Kilborne Ave Reno, NV 89509
Skyline Boulevard NeighborhoodEstimated Value: $597,000 - $635,000
4
Beds
2
Baths
1,684
Sq Ft
$364/Sq Ft
Est. Value
About This Home
This home is located at 420 Kilborne Ave, Reno, NV 89509 and is currently estimated at $613,139, approximately $364 per square foot. 420 Kilborne Ave is a home located in Washoe County with nearby schools including Huffaker Elementary School, Edward L Pine Middle School, and Reno High School.
Ownership History
Date
Name
Owned For
Owner Type
Purchase Details
Closed on
Jan 20, 2021
Sold by
Hartman Joseph and Hartman Grace
Bought by
Hartman Joseph and Hartman Grace
Current Estimated Value
Purchase Details
Closed on
Aug 5, 2014
Sold by
Richards David M
Bought by
Hartman Joseph and Hartman Grace
Home Financials for this Owner
Home Financials are based on the most recent Mortgage that was taken out on this home.
Original Mortgage
$250,381
Interest Rate
4.25%
Mortgage Type
FHA
Purchase Details
Closed on
Oct 18, 2011
Sold by
Richards David M
Bought by
Richards David M and David M Richards Trust
Purchase Details
Closed on
Jul 26, 1996
Sold by
Koyama Marie
Bought by
Lair Joan A
Home Financials for this Owner
Home Financials are based on the most recent Mortgage that was taken out on this home.
Original Mortgage
$100,000
Interest Rate
5.87%
Create a Home Valuation Report for This Property
The Home Valuation Report is an in-depth analysis detailing your home's value as well as a comparison with similar homes in the area
Home Values in the Area
Average Home Value in this Area
Purchase History
| Date | Buyer | Sale Price | Title Company |
|---|---|---|---|
| Hartman Joseph | -- | None Available | |
| Hartman Joseph | $255,000 | First American Title | |
| Richards David M | -- | None Available | |
| Lair Joan A | $170,000 | Western Title Company Inc |
Source: Public Records
Mortgage History
| Date | Status | Borrower | Loan Amount |
|---|---|---|---|
| Previous Owner | Hartman Joseph | $250,381 | |
| Previous Owner | Lair Joan A | $100,000 |
Source: Public Records
Tax History Compared to Growth
Tax History
| Year | Tax Paid | Tax Assessment Tax Assessment Total Assessment is a certain percentage of the fair market value that is determined by local assessors to be the total taxable value of land and additions on the property. | Land | Improvement |
|---|---|---|---|---|
| 2026 | $2,088 | $102,097 | $44,275 | $57,822 |
| 2025 | $2,709 | $102,946 | $43,680 | $59,266 |
| 2024 | $2,709 | $96,950 | $36,820 | $60,130 |
| 2023 | $2,440 | $91,407 | $39,165 | $52,242 |
| 2022 | $2,369 | $79,777 | $35,980 | $43,797 |
| 2021 | $2,301 | $69,196 | $25,375 | $43,821 |
| 2020 | $2,232 | $69,579 | $25,445 | $44,134 |
| 2019 | $2,167 | $67,776 | $24,920 | $42,856 |
| 2018 | $2,104 | $60,787 | $18,655 | $42,132 |
| 2017 | $2,044 | $59,236 | $16,870 | $42,366 |
| 2016 | $1,992 | $58,049 | $14,525 | $43,524 |
| 2015 | $1,989 | $57,992 | $14,525 | $43,467 |
| 2014 | $1,932 | $53,603 | $11,585 | $42,018 |
| 2013 | -- | $51,160 | $9,625 | $41,535 |
Source: Public Records
Map
Nearby Homes
- 795 Twin Pines Ct
- 4314 Clyde Ct
- 4233 Baker Ln
- 4185 Baker Ln
- 630 Sapphire Cir
- 4899 Cool Springs Dr
- 4022 Millbrook Ln
- 4009 Ruth Ct
- 4003 Bluegrass Ct Unit A
- 4004 Ruth Ct
- 4875 Golden Springs Dr
- 1160 Yates Ln
- 3834 Lakeside Dr Unit 18
- 3830 Lakeside Dr Unit 16
- 3828 Lakeside Dr Unit 15
- 718 W Pleasant Oak Trail
- 3826 Lakeside Dr Unit 14
- 2108 Chicory Way Unit 2108A
- 4740 Plumas St
- 5012 Lakeridge Terrace E
- 410 Kilborne Ave
- 430 Kilborne Ave
- 405 Brittany Ave
- 415 Brittany Ave
- 440 Kilborne Ave
- 400 Kilborne Ave
- 425 Brittany Ave
- 431 Kilborne Ave
- 390 Kilborne Ave
- 4750 Brittany Ct
- 421 Kilborne Ave
- 2070 Brittany Ave
- 410 Brittany Ave
- 400 Brittany Ave
- 4770 Brittany Ct
- 4690 Brittany Ct
- 420 Brittany Ave
- 411 Kilborne Ave
- 380 Kilborne Ave
- 4670 Brittany Ct