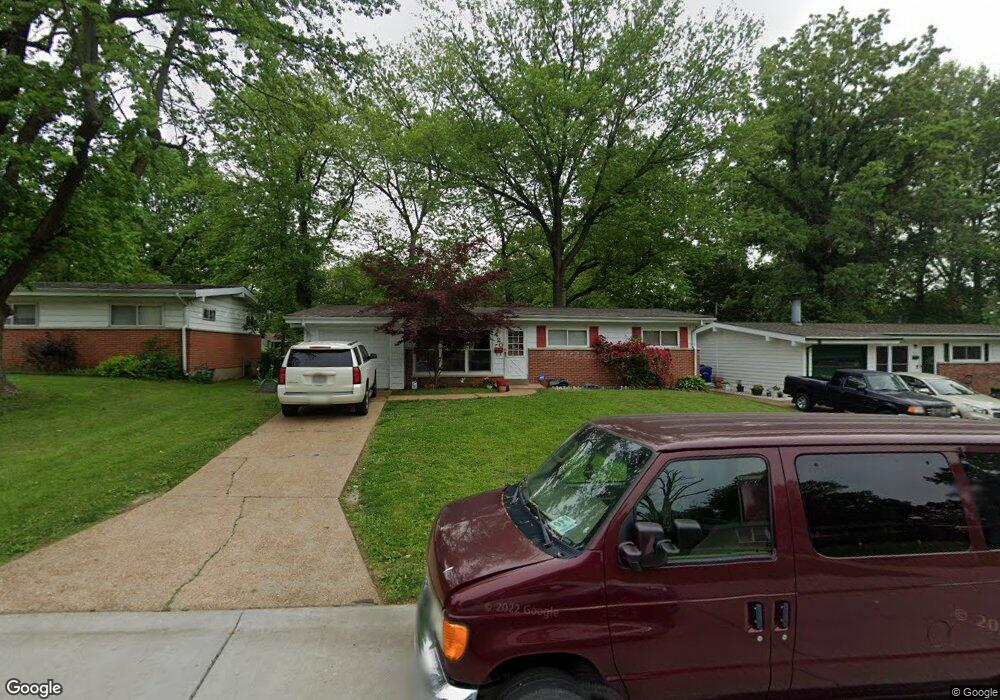
420 Larry Dr Florissant, MO 63033
Estimated Value: $130,000 - $171,000
3
Beds
2
Baths
1,150
Sq Ft
$132/Sq Ft
Est. Value
About This Home
This home is located at 420 Larry Dr, Florissant, MO 63033 and is currently estimated at $151,696, approximately $131 per square foot. 420 Larry Dr is a home located in St. Louis County with nearby schools including Duchesne Elementary School, Cross Keys Middle School, and McCluer North High School.
Ownership History
Date
Name
Owned For
Owner Type
Purchase Details
Closed on
Sep 14, 2022
Sold by
Cody Investments Llc
Bought by
Harris Kijuana and Brown Andrew S
Current Estimated Value
Home Financials for this Owner
Home Financials are based on the most recent Mortgage that was taken out on this home.
Original Mortgage
$101,495
Outstanding Balance
$96,967
Interest Rate
5.25%
Mortgage Type
FHA
Estimated Equity
$54,729
Purchase Details
Closed on
Apr 16, 2004
Sold by
Cody Properties Llc
Bought by
Cody Investments Llc
Purchase Details
Closed on
Oct 24, 2003
Sold by
Jenkins David A and Jenkins Michelle
Bought by
Cody Properties Llc
Purchase Details
Closed on
Jan 3, 1997
Sold by
Geringer Charles P and Geringer Lori A
Bought by
Jenkins David A and Jenkins Michelle
Home Financials for this Owner
Home Financials are based on the most recent Mortgage that was taken out on this home.
Original Mortgage
$72,900
Interest Rate
7.54%
Mortgage Type
FHA
Create a Home Valuation Report for This Property
The Home Valuation Report is an in-depth analysis detailing your home's value as well as a comparison with similar homes in the area
Home Values in the Area
Average Home Value in this Area
Purchase History
| Date | Buyer | Sale Price | Title Company |
|---|---|---|---|
| Harris Kijuana | -- | -- | |
| Cody Investments Llc | -- | -- | |
| Cody Properties Llc | $77,736 | -- | |
| Jenkins David A | -- | -- |
Source: Public Records
Mortgage History
| Date | Status | Borrower | Loan Amount |
|---|---|---|---|
| Open | Harris Kijuana | $101,495 | |
| Previous Owner | Jenkins David A | $72,900 |
Source: Public Records
Tax History Compared to Growth
Tax History
| Year | Tax Paid | Tax Assessment Tax Assessment Total Assessment is a certain percentage of the fair market value that is determined by local assessors to be the total taxable value of land and additions on the property. | Land | Improvement |
|---|---|---|---|---|
| 2025 | $2,107 | $29,350 | $4,330 | $25,020 |
| 2024 | $2,107 | $27,170 | $3,820 | $23,350 |
| 2023 | $2,100 | $27,170 | $3,820 | $23,350 |
| 2022 | $1,764 | $19,990 | $3,820 | $16,170 |
| 2021 | $1,734 | $19,990 | $3,820 | $16,170 |
| 2020 | $1,518 | $16,460 | $3,820 | $12,640 |
| 2019 | $1,489 | $16,460 | $3,820 | $12,640 |
| 2018 | $1,345 | $13,260 | $2,130 | $11,130 |
| 2017 | $1,338 | $13,260 | $2,130 | $11,130 |
| 2016 | $1,292 | $12,470 | $2,130 | $10,340 |
| 2015 | $1,299 | $12,470 | $2,130 | $10,340 |
| 2014 | $1,435 | $14,250 | $3,570 | $10,680 |
Source: Public Records
Map
Nearby Homes
- 2240 Brook Dr
- 505 Ridge Dr
- 1965 Saint Catherine St
- 2340 Saint Catherine St
- 785 Bobbins Ln
- 12 Country Ln
- 675 Pimlico Dr
- 765 Pimlico Dr
- 2505 Saint Catherine St
- 750 Robinwood Dr
- 1030 Robinwood Dr
- 805 Derhake Rd
- 13 Bayberry Ln
- 1290 Saint Louis St
- 629 Aubuchon St
- 2020 Washington St Unit 707
- 1040 Bluefield Dr
- 150 Saint Daniel Ln
- 1130 Saint Francois St
- 1200 Bluefield Dr
- 430 Larry Dr
- 410 Larry Dr
- 440 Larry Dr
- 400 Larry Dr
- 415 Saint Edward Ln
- 415 St Edwards Ln
- 405 Saint Edward Ln
- 425 Saint Edward Ln
- 425 St Edward Ln
- 415 Larry Dr
- 435 Saint Edward Ln
- 395 Saint Edward Ln
- 390 Larry Dr
- 460 Larry Dr
- 405 Larry Dr
- 425 Larry Dr
- 395 Larry Dr
- 385 Saint Edward Ln
- 435 Larry Dr
- 455 Saint Edward Ln