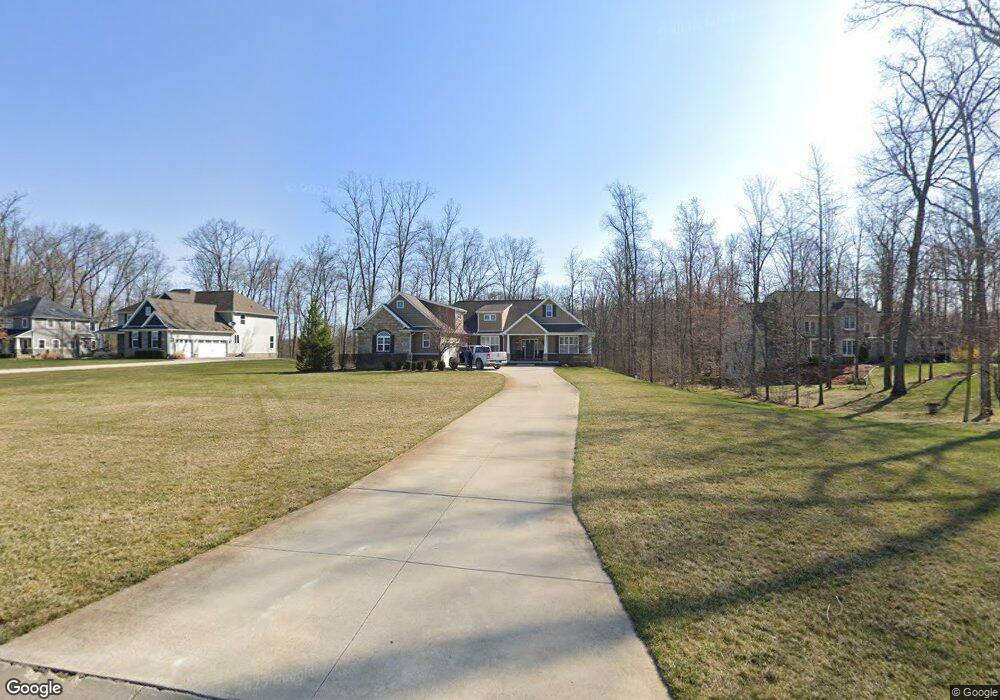
420 Lenox Ln Brighton, MI 48114
Estimated Value: $688,000 - $826,000
4
Beds
4
Baths
2,736
Sq Ft
$276/Sq Ft
Est. Value
About This Home
This home is located at 420 Lenox Ln, Brighton, MI 48114 and is currently estimated at $754,977, approximately $275 per square foot. 420 Lenox Ln is a home located in Livingston County with nearby schools including Hartland High School and Maple Tree Montessori Academy.
Ownership History
Date
Name
Owned For
Owner Type
Purchase Details
Closed on
Apr 19, 2022
Sold by
Smith Meghann J
Bought by
Smith Nicholas B
Current Estimated Value
Home Financials for this Owner
Home Financials are based on the most recent Mortgage that was taken out on this home.
Original Mortgage
$334,700
Interest Rate
5.13%
Mortgage Type
New Conventional
Purchase Details
Closed on
Dec 22, 2017
Sold by
Barringer Christine
Bought by
Smith Nicholas B and Smith Meghann J
Purchase Details
Closed on
Sep 19, 2016
Sold by
Capital Construction Group Llc
Bought by
Barringer Christine
Home Financials for this Owner
Home Financials are based on the most recent Mortgage that was taken out on this home.
Original Mortgage
$76,800
Interest Rate
3.43%
Mortgage Type
Future Advance Clause Open End Mortgage
Purchase Details
Closed on
Apr 23, 2015
Sold by
Solstice Hoomesites Llc
Bought by
Capital Construction Group Llc
Create a Home Valuation Report for This Property
The Home Valuation Report is an in-depth analysis detailing your home's value as well as a comparison with similar homes in the area
Home Values in the Area
Average Home Value in this Area
Purchase History
| Date | Buyer | Sale Price | Title Company |
|---|---|---|---|
| Smith Nicholas B | -- | None Listed On Document | |
| Smith Nicholas B | $107,000 | -- | |
| Barringer Christine | $97,500 | None Available | |
| Capital Construction Group Llc | $130,000 | Select Title Agency |
Source: Public Records
Mortgage History
| Date | Status | Borrower | Loan Amount |
|---|---|---|---|
| Previous Owner | Smith Nicholas B | $334,700 | |
| Previous Owner | Barringer Christine | $76,800 |
Source: Public Records
Tax History Compared to Growth
Tax History
| Year | Tax Paid | Tax Assessment Tax Assessment Total Assessment is a certain percentage of the fair market value that is determined by local assessors to be the total taxable value of land and additions on the property. | Land | Improvement |
|---|---|---|---|---|
| 2025 | $8,549 | $361,100 | $0 | $0 |
| 2024 | $4,105 | $348,900 | $0 | $0 |
| 2023 | $3,923 | $317,500 | $0 | $0 |
| 2022 | $7,481 | $197,100 | $0 | $0 |
| 2021 | $7,481 | $290,700 | $0 | $0 |
| 2020 | $7,481 | $277,700 | $0 | $0 |
| 2019 | $8,533 | $197,100 | $0 | $0 |
| 2018 | $1,821 | $41,300 | $0 | $0 |
| 2017 | $1,824 | $41,300 | $0 | $0 |
| 2016 | $1,244 | $27,500 | $0 | $0 |
| 2014 | -- | $17,500 | $0 | $0 |
| 2012 | -- | $18,530 | $0 | $0 |
Source: Public Records
Map
Nearby Homes
- 329 Baintree Blvd
- 1318 Gray Haven Ln
- 316 Lenox Ln
- 198 W Auburn Trail Unit 31
- 149 W Auburn Trail
- 10914 Doves Point
- C-1 Doa
- 10579 Lee Ann Dr
- V/L Commerce Rd
- 227 W Peterson Dr
- 10238 Shenandoah Ridge Dr
- Vacant Lot 51 Rosemarie Run
- 2750 Kensington Rd
- 10050 Hyne Rd
- 10493 Spring Grove
- 9975 Havendale Dr
- 43 Candlelight Ct
- LOT 51 Rosemarie Run
- 0 Northpointe Ridge Unit 20240035531
- 9997 Applegate Ln
- 96 Lenox Ln
- 414 Lenox Ln
- 99 Lenox Ln
- 138 Lenox Ln
- 136 Lenox Ln
- 129 Lenox Ln
- 94 Lenox Ln
- 134 Lenox Ln
- 109 Lenox Ln
- 117 Lenox Ln
- 106 Lenox Ln
- 0 U-99 Lenox Ln
- 411 Lenox Ln
- 0 UNIT 99 Lenox
- 402 Lenox Ln
- VL Baintree (Lot 93) Blvd
- 93 Baintree Blvd
- TBD Baintree Blvd Lot 93
- 389 Baintree Blvd
- 389 Baintree Blvd