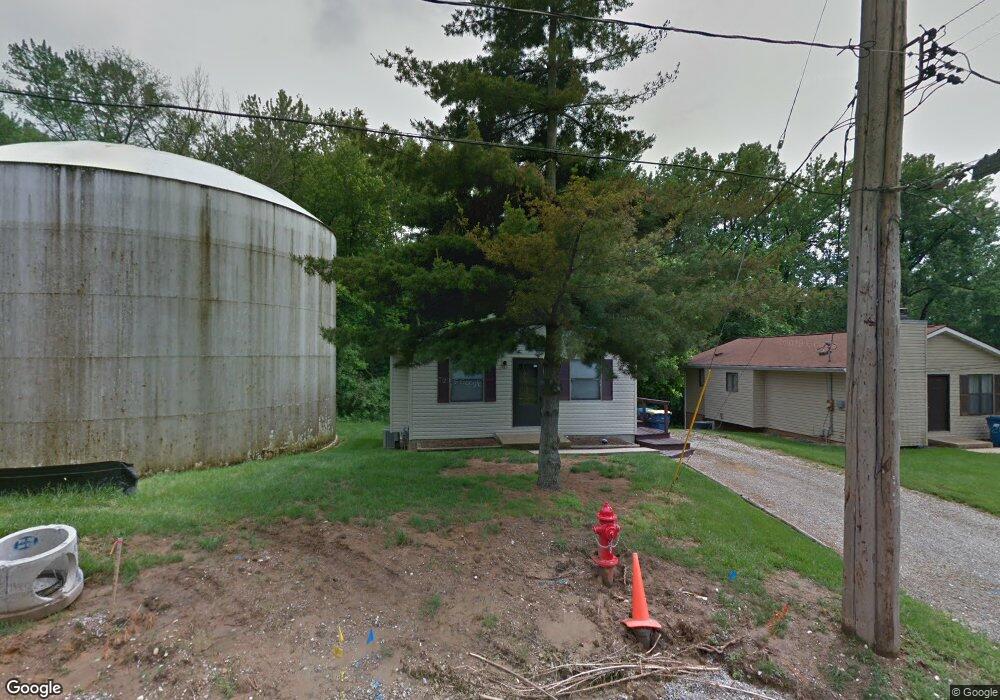
420 M St Edwardsville, IL 62025
Estimated Value: $147,000 - $215,000
3
Beds
1
Bath
864
Sq Ft
$208/Sq Ft
Est. Value
About This Home
This home is located at 420 M St, Edwardsville, IL 62025 and is currently estimated at $180,000, approximately $208 per square foot. 420 M St is a home located in Madison County with nearby schools including N.O. Nelson Elementary School, Woodland Elementary School, and Lincoln Middle School.
Ownership History
Date
Name
Owned For
Owner Type
Purchase Details
Closed on
Oct 13, 2022
Sold by
Meyer Residential Ii Llc
Bought by
Blue Note Acquisitions Llc
Current Estimated Value
Home Financials for this Owner
Home Financials are based on the most recent Mortgage that was taken out on this home.
Original Mortgage
$535,000
Outstanding Balance
$514,286
Interest Rate
5.89%
Mortgage Type
Commercial
Estimated Equity
-$334,286
Purchase Details
Closed on
Feb 25, 2015
Sold by
Meyer Betsy A
Bought by
Meyer Betsy A
Create a Home Valuation Report for This Property
The Home Valuation Report is an in-depth analysis detailing your home's value as well as a comparison with similar homes in the area
Home Values in the Area
Average Home Value in this Area
Purchase History
| Date | Buyer | Sale Price | Title Company |
|---|---|---|---|
| Blue Note Acquisitions Llc | $480,000 | Abstracts & Titles | |
| Meyer Betsy A | -- | Fatic | |
| Meyer Betsy A | -- | Fatic |
Source: Public Records
Mortgage History
| Date | Status | Borrower | Loan Amount |
|---|---|---|---|
| Open | Blue Note Acquisitions Llc | $535,000 |
Source: Public Records
Tax History
| Year | Tax Paid | Tax Assessment Tax Assessment Total Assessment is a certain percentage of the fair market value that is determined by local assessors to be the total taxable value of land and additions on the property. | Land | Improvement |
|---|---|---|---|---|
| 2024 | $3,084 | $43,200 | $8,790 | $34,410 |
| 2023 | $3,084 | $40,090 | $8,160 | $31,930 |
| 2022 | $2,904 | $37,060 | $7,540 | $29,520 |
| 2021 | $2,615 | $35,180 | $7,160 | $28,020 |
| 2020 | $2,536 | $34,090 | $6,940 | $27,150 |
| 2019 | $2,520 | $33,520 | $6,820 | $26,700 |
| 2018 | $2,480 | $32,020 | $6,520 | $25,500 |
| 2017 | $2,417 | $31,340 | $6,380 | $24,960 |
| 2016 | $2,188 | $31,340 | $6,380 | $24,960 |
| 2015 | $2,105 | $29,050 | $5,910 | $23,140 |
| 2014 | $2,105 | $29,050 | $5,910 | $23,140 |
| 2013 | $2,105 | $29,050 | $5,910 | $23,140 |
Source: Public Records
Map
Nearby Homes
- 1407 Eberhart Ave
- 324 M St
- 317 M St
- 805 Kingshighway St
- 911 Grand Ave
- 652 N Kansas St Unit 652-A
- 652 N Kansas St Unit 652-B
- 652 N Kansas St Unit 652-A & B
- 4506 Drda Ln
- 725 Randle St
- 606 N Main St
- 215 Clay St
- 300 S Charles St
- 217 S Myrtle St
- 142 West St
- 229 Commercial St
- 4800 N State Route 159
- 232 S Main St
- 5 Rock Hill Ct
- 208 S Fillmore St
Your Personal Tour Guide
Ask me questions while you tour the home.