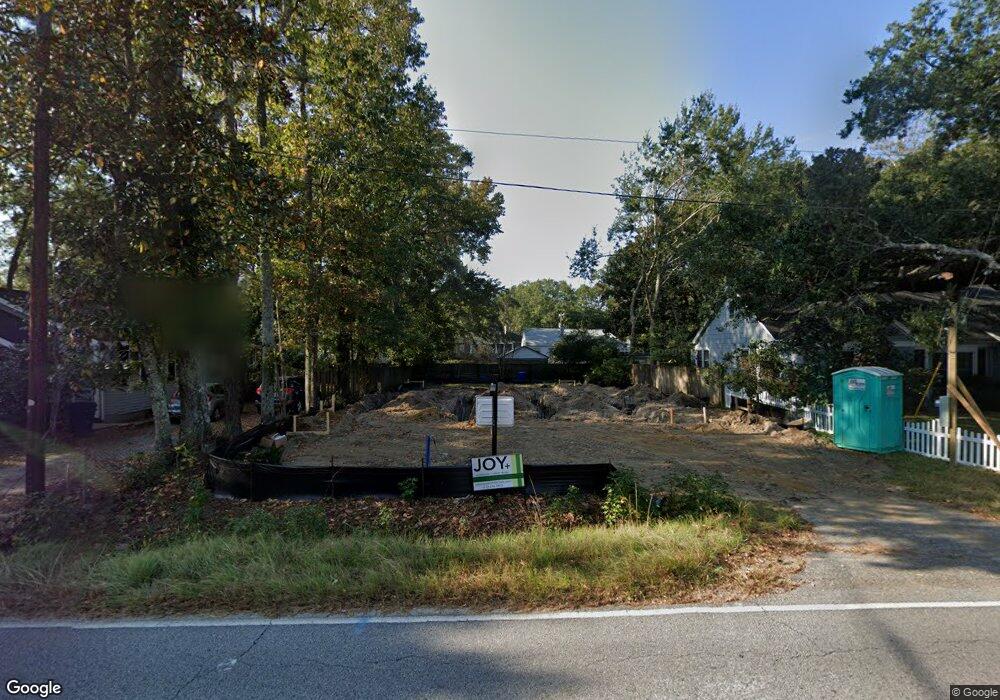
420 Magnolia Rd Charleston, SC 29407
Estimated Value: $518,000 - $691,000
3
Beds
2
Baths
1,176
Sq Ft
$501/Sq Ft
Est. Value
About This Home
This home is located at 420 Magnolia Rd, Charleston, SC 29407 and is currently estimated at $588,683, approximately $500 per square foot. 420 Magnolia Rd is a home located in Charleston County with nearby schools including St. Andrews School Of Math And Science, West Ashley High School, and Blessed Sacrament Catholic School.
Ownership History
Date
Name
Owned For
Owner Type
Purchase Details
Closed on
Jun 8, 2024
Sold by
Flumian Joseph R and Flumian Julia M
Bought by
Flumian Julia M and Luginbill Daniel W
Current Estimated Value
Home Financials for this Owner
Home Financials are based on the most recent Mortgage that was taken out on this home.
Original Mortgage
$1,000,000
Outstanding Balance
$989,223
Interest Rate
7.5%
Mortgage Type
Construction
Estimated Equity
-$400,540
Purchase Details
Closed on
Oct 20, 2011
Sold by
Hostetler Dale W and Hostetler Faith J
Bought by
Flumina Julia M and Flumian Joseph R
Home Financials for this Owner
Home Financials are based on the most recent Mortgage that was taken out on this home.
Original Mortgage
$189,000
Interest Rate
4.16%
Mortgage Type
New Conventional
Purchase Details
Closed on
Sep 14, 2006
Sold by
Family Services Inc and Butler Frances Q
Bought by
Hostetler Dale W and Hostetler Faith J
Create a Home Valuation Report for This Property
The Home Valuation Report is an in-depth analysis detailing your home's value as well as a comparison with similar homes in the area
Home Values in the Area
Average Home Value in this Area
Purchase History
| Date | Buyer | Sale Price | Title Company |
|---|---|---|---|
| Flumian Julia M | -- | None Listed On Document | |
| Flumina Julia M | $252,000 | -- | |
| Hostetler Dale W | $162,500 | None Available |
Source: Public Records
Mortgage History
| Date | Status | Borrower | Loan Amount |
|---|---|---|---|
| Open | Flumian Julia M | $1,000,000 | |
| Previous Owner | Flumina Julia M | $189,000 |
Source: Public Records
Tax History Compared to Growth
Tax History
| Year | Tax Paid | Tax Assessment Tax Assessment Total Assessment is a certain percentage of the fair market value that is determined by local assessors to be the total taxable value of land and additions on the property. | Land | Improvement |
|---|---|---|---|---|
| 2024 | $1,724 | $9,700 | $0 | $0 |
| 2023 | $1,724 | $9,700 | $0 | $0 |
| 2022 | $1,626 | $9,700 | $0 | $0 |
| 2021 | $1,680 | $9,700 | $0 | $0 |
| 2020 | $1,698 | $9,700 | $0 | $0 |
| 2019 | $1,473 | $8,440 | $0 | $0 |
| 2017 | $1,398 | $8,440 | $0 | $0 |
| 2016 | $1,344 | $8,440 | $0 | $0 |
| 2015 | $1,354 | $8,440 | $0 | $0 |
| 2014 | $1,534 | $0 | $0 | $0 |
| 2011 | -- | $0 | $0 | $0 |
Source: Public Records
Map
Nearby Homes
- 212 Magnolia Rd
- 45 Sycamore Ave Unit 535
- 45 Sycamore Ave Unit 1133
- 45 Sycamore Ave Unit 225
- 45 Sycamore Ave Unit 1137
- 712 Longfellow Rd
- 103 Tall Oak Ave
- 0 Anita Dr Unit 25026053
- 48 Avondale Ave
- 757 Longfellow Rd
- 24 Oakdale Place
- 5 Jerry Dr
- 8 Stratford Rd
- 699 Savannah Hwy
- 1103 Byron Rd
- 18 Lyttleton Ave
- 1121 Browning Rd
- 1157 Symmes Dr
- 33 Yeadon Ave
- 45 Colleton Dr
- 440 Magnolia Rd
- 400 Magnolia Rd
- 460 Magnolia Rd
- 318 Magnolia Rd
- 13 Wedgepark Rd
- 2 Live Oak Ave
- 17 Wedgepark Rd
- 11 Wedgepark Rd
- 306 Magnolia Rd
- 480 Magnolia Rd
- 306 Magnolia Rd
- 441 Magnolia Rd
- 19 Wedgepark Rd
- 19 Wedgepark Rd
- 21 Wedgepark Rd
- 38 Magnolia Rd
- 1 Live Oak Ave
- 500 Magnolia Rd
- 4 Live Oak Ave
- 623 Maylen Rd