Estimated Value: $101,586 - $158,000
2
Beds
1
Bath
960
Sq Ft
$130/Sq Ft
Est. Value
About This Home
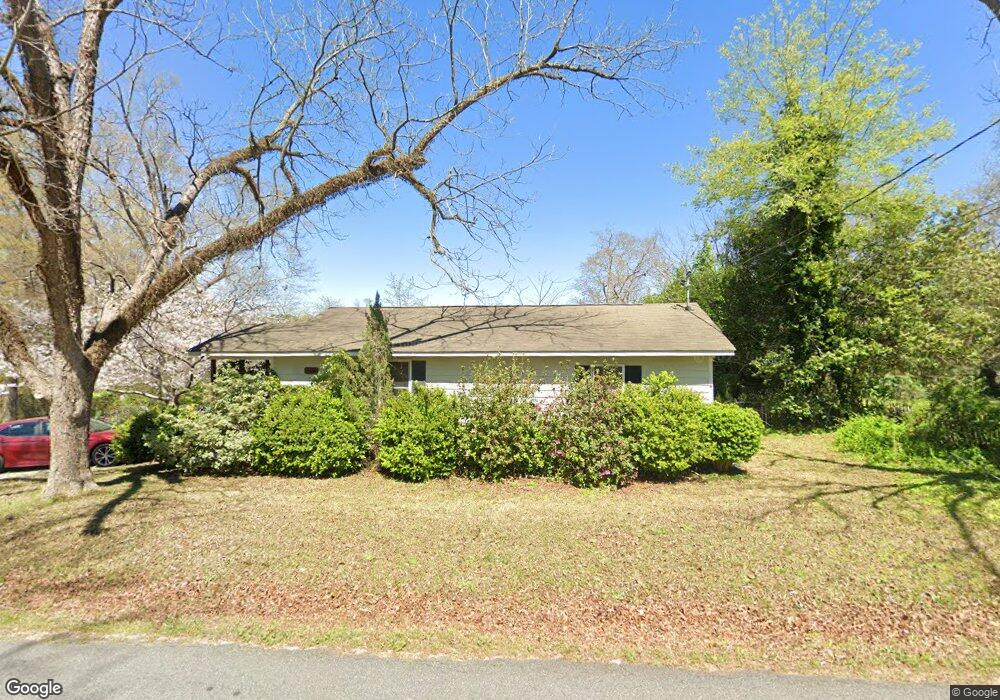
This home is located at 420 Main St, Byron, GA 31008 and is currently estimated at $124,647, approximately $129 per square foot. 420 Main St is a home located in Peach County with nearby schools including Byron Elementary School, Byron Middle School, and Peach County High School.
Ownership History
Date
Name
Owned For
Owner Type
Purchase Details
Closed on
Dec 3, 2013
Sold by
Smallwood Christopher
Bought by
Smallwood Richard
Current Estimated Value
Purchase Details
Closed on
Aug 12, 2009
Sold by
Donaldson Shannon D and Taylor Marsha R
Bought by
Smallwood Christopher R
Purchase Details
Closed on
Aug 4, 2006
Sold by
Us Department Of Housing A
Bought by
Donaldson Shannon D
Home Financials for this Owner
Home Financials are based on the most recent Mortgage that was taken out on this home.
Original Mortgage
$32,000
Interest Rate
6.71%
Mortgage Type
New Conventional
Purchase Details
Closed on
Apr 5, 2005
Sold by
Citimortgage Inc
Bought by
Sec Of Housing & Urban
Purchase Details
Closed on
Mar 30, 1998
Bought by
Williams Wesley S and Bass Janice L
Purchase Details
Closed on
Nov 21, 1994
Bought by
Newsome Wayne N and Newsome Susan D
Purchase Details
Closed on
Feb 1, 1993
Bought by
Brannon Terry L
Purchase Details
Closed on
Aug 13, 1984
Bought by
Brannon Nora S
Create a Home Valuation Report for This Property
The Home Valuation Report is an in-depth analysis detailing your home's value as well as a comparison with similar homes in the area
Home Values in the Area
Average Home Value in this Area
Purchase History
| Date | Buyer | Sale Price | Title Company |
|---|---|---|---|
| Smallwood Richard | -- | -- | |
| Smallwood Christopher R | $74,000 | -- | |
| Donaldson Shannon D | $84,250 | -- | |
| Sec Of Housing & Urban | $47,251 | -- | |
| Citimortgage Inc | $47,251 | -- | |
| Williams Wesley S | $42,500 | -- | |
| Newsome Wayne N | $30,000 | -- | |
| Brannon Terry L | -- | -- | |
| Brannon Nora S | -- | -- |
Source: Public Records
Mortgage History
| Date | Status | Borrower | Loan Amount |
|---|---|---|---|
| Previous Owner | Donaldson Shannon D | $32,000 |
Source: Public Records
Tax History Compared to Growth
Tax History
| Year | Tax Paid | Tax Assessment Tax Assessment Total Assessment is a certain percentage of the fair market value that is determined by local assessors to be the total taxable value of land and additions on the property. | Land | Improvement |
|---|---|---|---|---|
| 2024 | $1,048 | $29,360 | $3,400 | $25,960 |
| 2023 | $1,052 | $29,280 | $2,720 | $26,560 |
| 2022 | $701 | $26,040 | $2,720 | $23,320 |
| 2021 | $688 | $22,040 | $2,720 | $19,320 |
| 2020 | $693 | $22,200 | $2,720 | $19,480 |
| 2019 | $697 | $22,200 | $2,720 | $19,480 |
| 2018 | $700 | $22,200 | $2,720 | $19,480 |
| 2017 | $704 | $22,200 | $2,720 | $19,480 |
| 2016 | $701 | $22,200 | $2,720 | $19,480 |
| 2015 | $702 | $22,200 | $2,720 | $19,480 |
| 2014 | $703 | $22,200 | $2,720 | $19,480 |
| 2013 | -- | $22,200 | $2,720 | $19,480 |
Source: Public Records
Map
Nearby Homes
- 103 Fawn Ct
- 101 Fawn Ct
- 119 Buckskin Trail
- 506 Howard St
- 125 Buckskin Trail
- 102 Silver Maple Ct
- 107 Silver Maple Ct
- 109 Silver Maple Ct
- 00 Georgia 49
- 104 Robinson St
- 0 Moseley Rd Unit 10582548
- 0 Moseley Rd Unit 255314
- 0 Moseley Rd Unit 180905
- 203 Colonial Dr
- 350 Georgia 42
- 0 W White Rd Unit 329733
- 113 Sweetspire Ln
- 809 Elwood Cir
- 104 Chickasaw Ct
- 109 Abelia Ln
- 418 Main St
- 419 Main St
- 415 Main St
- 407 Main St
- 423 Main St Unit 1
- 423 Main St
- 0 Main St Unit 8667429
- 0 Main St Unit 7459851
- 0 Main St Unit 9041707
- 0 Main St Unit 8803785
- 0 Main St Unit 3173781
- 0 Main St
- 427 Main St
- 405 Main St
- 111 2nd St
- 101 Pine Crest Dr
- 403 Main St
- 403 Main St Unit 1
- 411 Main St
- 109 2nd St