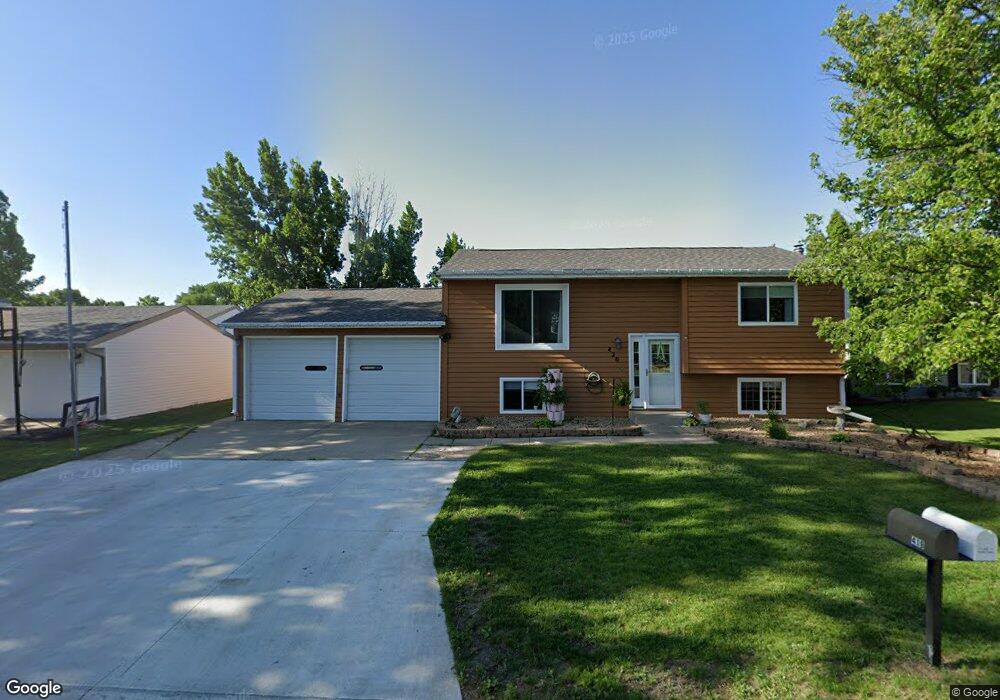
420 Maple Dr Mapleton, ND 58059
Estimated Value: $263,000 - $288,000
4
Beds
2
Baths
1,960
Sq Ft
$139/Sq Ft
Est. Value
About This Home
This home is located at 420 Maple Dr, Mapleton, ND 58059 and is currently estimated at $272,422, approximately $138 per square foot. 420 Maple Dr is a home located in Cass County with nearby schools including Mapleton Elementary School.
Ownership History
Date
Name
Owned For
Owner Type
Purchase Details
Closed on
Oct 24, 2019
Sold by
Brodal Cody J and Brodal Amber A
Bought by
Kressin Jordan and Kressin Caitlyn D
Current Estimated Value
Home Financials for this Owner
Home Financials are based on the most recent Mortgage that was taken out on this home.
Original Mortgage
$213,303
Outstanding Balance
$186,864
Interest Rate
3.5%
Mortgage Type
New Conventional
Estimated Equity
$85,558
Purchase Details
Closed on
Feb 11, 2010
Sold by
Anderson Rita F and Anderson Roger A
Bought by
Brodal Cody J and Brodal Amber A
Home Financials for this Owner
Home Financials are based on the most recent Mortgage that was taken out on this home.
Original Mortgage
$133,038
Interest Rate
5.25%
Mortgage Type
FHA
Purchase Details
Closed on
Nov 27, 2007
Sold by
Schmit Leonard J
Bought by
Schmit Rita F
Create a Home Valuation Report for This Property
The Home Valuation Report is an in-depth analysis detailing your home's value as well as a comparison with similar homes in the area
Purchase History
| Date | Buyer | Sale Price | Title Company |
|---|---|---|---|
| Kressin Jordan | $219,900 | Title Co | |
| Brodal Cody J | -- | -- | |
| Schmit Rita F | -- | -- |
Source: Public Records
Mortgage History
| Date | Status | Borrower | Loan Amount |
|---|---|---|---|
| Open | Kressin Jordan | $213,303 | |
| Previous Owner | Brodal Cody J | $133,038 |
Source: Public Records
Tax History
| Year | Tax Paid | Tax Assessment Tax Assessment Total Assessment is a certain percentage of the fair market value that is determined by local assessors to be the total taxable value of land and additions on the property. | Land | Improvement |
|---|---|---|---|---|
| 2024 | $2,790 | $116,150 | $18,350 | $97,800 |
| 2023 | $3,240 | $116,500 | $18,350 | $98,150 |
| 2022 | $2,774 | $106,800 | $18,350 | $88,450 |
| 2021 | $2,622 | $97,550 | $14,150 | $83,400 |
| 2020 | $2,494 | $94,850 | $14,150 | $80,700 |
| 2019 | $2,496 | $94,850 | $14,150 | $80,700 |
| 2018 | $2,551 | $94,850 | $14,150 | $80,700 |
| 2017 | $2,484 | $93,000 | $14,150 | $78,850 |
| 2016 | $1,455 | $69,100 | $6,900 | $62,200 |
| 2015 | $1,292 | $64,000 | $6,400 | $57,600 |
| 2014 | $1,268 | $58,150 | $5,800 | $52,350 |
| 2013 | $1,289 | $58,150 | $5,800 | $52,350 |
Source: Public Records
Map
Nearby Homes
Your Personal Tour Guide
Ask me questions while you tour the home.