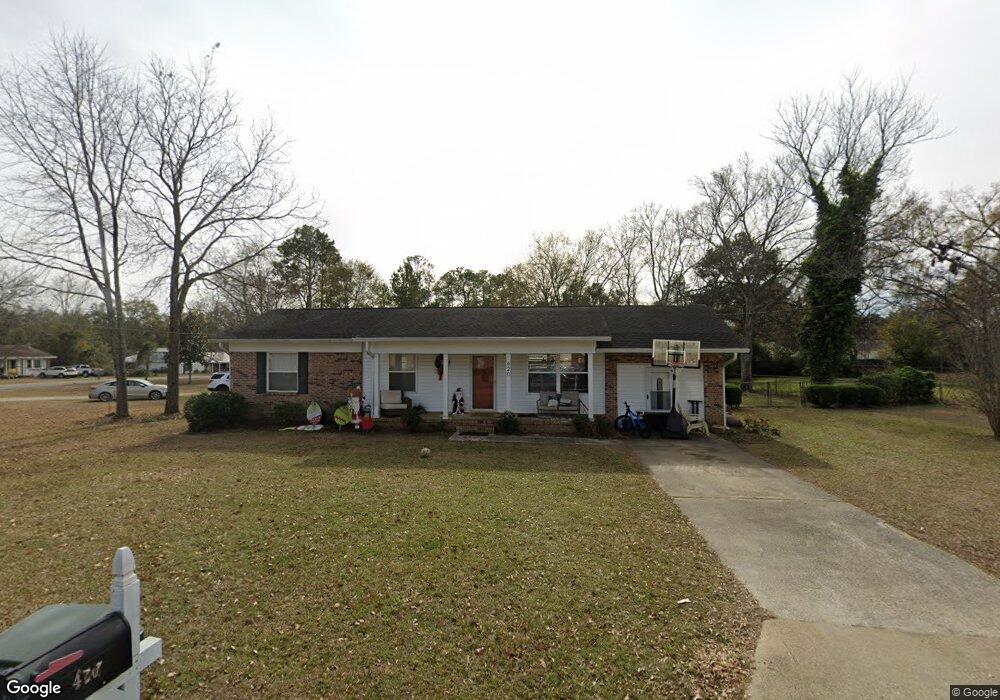
420 Meadowbrook Dr Blakely, GA 39823
Estimated Value: $109,000 - $132,000
About This Home
This home is located at 420 Meadowbrook Dr, Blakely, GA 39823 and is currently estimated at $119,762, approximately $84 per square foot. 420 Meadowbrook Dr is a home located in Early County with nearby schools including Early County Elementary School, Early County Middle School, and Early County High School.
Ownership History
We collect this data history from publicly available records. To have your information removed, we recommend requesting removal directly through your county’s website.
Purchase Details
Purchase Details
Purchase Details
Purchase Details
Purchase Details
Purchase Details
Purchase Details
Purchase Details
Home Values in the Area
Average Home Value in this Area
Purchase History
We collect this data history from publicly available records. To have your information removed, we recommend requesting removal directly through your county’s website.
| Date | Buyer | Sale Price | Title Company |
|---|---|---|---|
| $50,000 | -- | ||
| -- | -- | ||
| $60,000 | -- | ||
| $38,000 | -- | ||
| -- | -- | ||
| -- | -- | ||
| $31,000 | -- | ||
| $25,000 | -- |
Tax History
We collect this data history from publicly available records. To have your information removed, we recommend requesting removal directly through your county’s website.
| Year | Tax Paid | Tax Assessment Tax Assessment Total Assessment is a certain percentage of the fair market value that is determined by local assessors to be the total taxable value of land and additions on the property. | Land | Improvement |
|---|---|---|---|---|
| 2025 | $1,631 | $48,848 | $3,740 | $45,108 |
| 2024 | $1,144 | $37,023 | $3,740 | $33,283 |
| 2023 | $998 | $37,023 | $3,740 | $33,283 |
| 2022 | $889 | $35,253 | $3,740 | $31,513 |
| 2021 | $797 | $31,296 | $3,740 | $27,556 |
| 2020 | $782 | $31,296 | $3,740 | $27,556 |
| 2019 | $792 | $30,792 | $3,740 | $27,052 |
| 2018 | $923 | $30,792 | $3,740 | $27,052 |
| 2017 | $924 | $30,792 | $3,740 | $27,052 |
| 2016 | $842 | $28,156 | $3,740 | $24,416 |
| 2015 | -- | $28,522 | $3,740 | $24,782 |
| 2014 | -- | $28,522 | $3,740 | $24,782 |
| 2013 | -- | $27,316 | $3,740 | $23,576 |
Map
- 14509 River St
- 0 Dasaree Ln Unit 10683861
- 234 College St
- 337 College St
- Oak St
- -- Flower Dr
- 8 Lots Unknown Ln
- 1827 Tarver Dr
- 0000 Martin Luther King Junior Blvd
- 439 S Flowers Dr
- 2019 S Main St
- 239 Garden Dr
- 115 S Central Ave
- 21 E Railroad Ln
- 96 Jesse Johnson Dr
- 507 Lakewood Dr
- 451 Lakewood Dr
- 182 Lakewood Dr
- 187 Evergreen Ave
- 436 Lakewood Dr
- 398 Meadowbrook Dr
- 456 Meadowbrook Dr
- 384 Meadowbrook Dr
- 415 Meadowbrook Dr
- 71 Angela Dr
- 91 Angela Dr
- 397 Meadowbrook Dr
- 425 Meadowbrook Dr
- 433 Meadowbrook Dr
- 55 Angela Dr
- 368 Meadowbrook Dr
- 43 Angela Dr
- 373 Meadowbrook Dr
- 473 Meadowbrook Dr
- 350 Meadowbrook Dr
- 514 Meadowbrook Dr
- 497 Meadowbrook Dr
- 355 Meadowbrook Dr
- 27 Angela Dr
- 338 Meadowbrook Dr
Ask me questions while you tour the home.