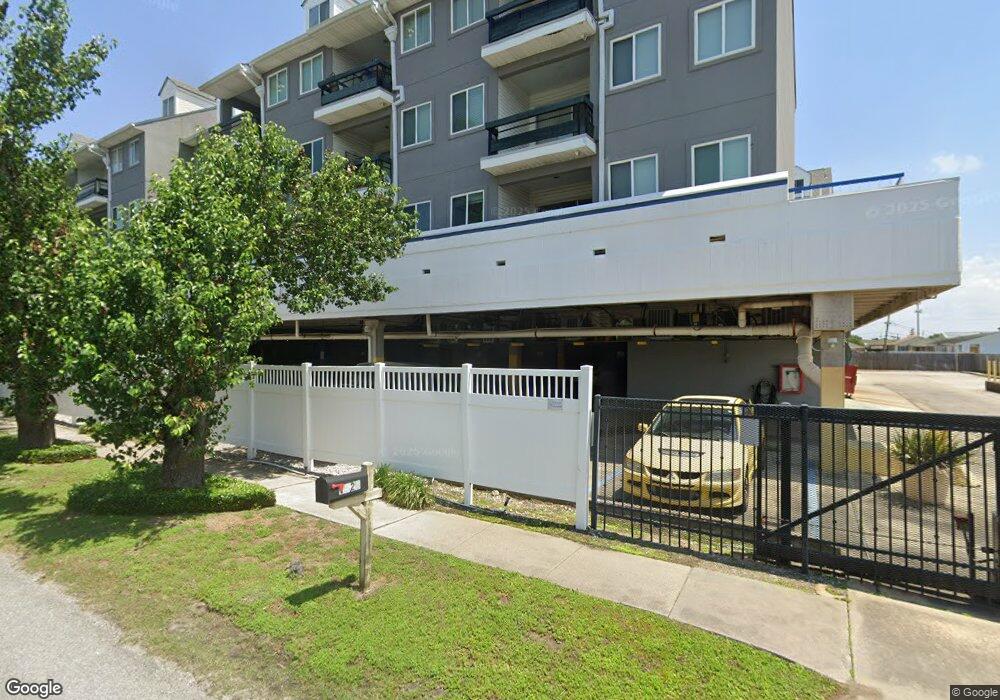
420 Metairie-Hammond Hwy Unit 228 Metairie, LA 70005
Bucktown NeighborhoodEstimated Value: $199,000 - $219,665
1
Bed
1
Bath
813
Sq Ft
$257/Sq Ft
Est. Value
About This Home
This home is located at 420 Metairie-Hammond Hwy Unit 228, Metairie, LA 70005 and is currently estimated at $209,166, approximately $257 per square foot. 420 Metairie-Hammond Hwy Unit 228 is a home located in Jefferson Parish with nearby schools including Marie B. Riviere Elementary School, Metairie Academy For Advanced Studies, and J.D. Meisler Middle School.
Ownership History
Date
Name
Owned For
Owner Type
Purchase Details
Closed on
May 30, 2025
Sold by
Norman Family Irrevocable Trust and Norman Thomas Richard
Bought by
Burleson Gary Dwayne
Current Estimated Value
Home Financials for this Owner
Home Financials are based on the most recent Mortgage that was taken out on this home.
Original Mortgage
$184,500
Outstanding Balance
$184,028
Interest Rate
6.83%
Mortgage Type
New Conventional
Estimated Equity
$25,138
Create a Home Valuation Report for This Property
The Home Valuation Report is an in-depth analysis detailing your home's value as well as a comparison with similar homes in the area
Home Values in the Area
Average Home Value in this Area
Purchase History
| Date | Buyer | Sale Price | Title Company |
|---|---|---|---|
| Burleson Gary Dwayne | $205,000 | Crescent Title |
Source: Public Records
Mortgage History
| Date | Status | Borrower | Loan Amount |
|---|---|---|---|
| Open | Burleson Gary Dwayne | $184,500 |
Source: Public Records
Tax History Compared to Growth
Tax History
| Year | Tax Paid | Tax Assessment Tax Assessment Total Assessment is a certain percentage of the fair market value that is determined by local assessors to be the total taxable value of land and additions on the property. | Land | Improvement |
|---|---|---|---|---|
| 2024 | $673 | $15,260 | $430 | $14,830 |
| 2023 | $1,934 | $14,700 | $430 | $14,270 |
| 2022 | $1,883 | $14,700 | $430 | $14,270 |
| 2021 | $1,749 | $14,700 | $430 | $14,270 |
| 2020 | $1,737 | $14,700 | $430 | $14,270 |
| 2019 | $1,700 | $14,000 | $430 | $13,570 |
| 2018 | $1,588 | $14,000 | $430 | $13,570 |
| 2017 | $1,588 | $14,000 | $430 | $13,570 |
| 2016 | $1,557 | $14,000 | $430 | $13,570 |
| 2015 | $1,432 | $12,730 | $370 | $12,360 |
| 2014 | $1,432 | $12,730 | $370 | $12,360 |
Source: Public Records
Map
Nearby Homes
- 425 Live Oak St
- 400 Metairie Hammond Hwy Unit 2A
- 400 Metairie Hammond Hwy Unit 2C
- 420 Metairie Hammond Hwy Unit 208
- 420 Metairie Hammond Hwy Unit 328
- 1428 Seminole Ave
- 1440 Huron Ave
- 1734 Orpheum Ave
- 1435 Cherokee Ave
- 1626 Orpheum Ave
- 1622 Orpheum Ave
- 1330 Seminole Ave
- 1456 Cherokee Ave
- 307 Live Oak St
- 1516 Aztec Ave Unit 208
- 1329 Sigur Ave
- 420 Metairie-Hammond Hwy
- 420 Met Hammond Hwy Unit 131
- 420 Metairie-Hammond Hwy Unit 209
- 420 Metairie-Hammond Hwy Unit 311
- 420 Metairie-Hammond Hwy Unit 320
- 420 Metairie-Hammond Hwy Unit 208
- 420 Metairie-Hammond Hwy Unit 216
- 420 Metairie-Hammond Hwy Unit 110
- 420 Metairie-Hammond Hwy Unit 326
- 420 Metairie-Hammond Hwy Unit 302
- 420 Metairie-Hammond Hwy Unit 103
- 420 Metairie-Hammond Hwy Unit 121
- 420 Metairie-Hammond Hwy Unit 206
- 420 Metairie-Hammond Hwy Unit 112
- 420 Metairie-Hammond Hwy Unit 219
- 420 Metairie-Hammond Hwy Unit 114
- 420 Metairie-Hammond Hwy Unit 327
- 420 Metairie-Hammond Hwy Unit 307
- 420 Metairie-Hammond Hwy Unit 330
- 420 Metairie-Hammond Hwy Unit 331