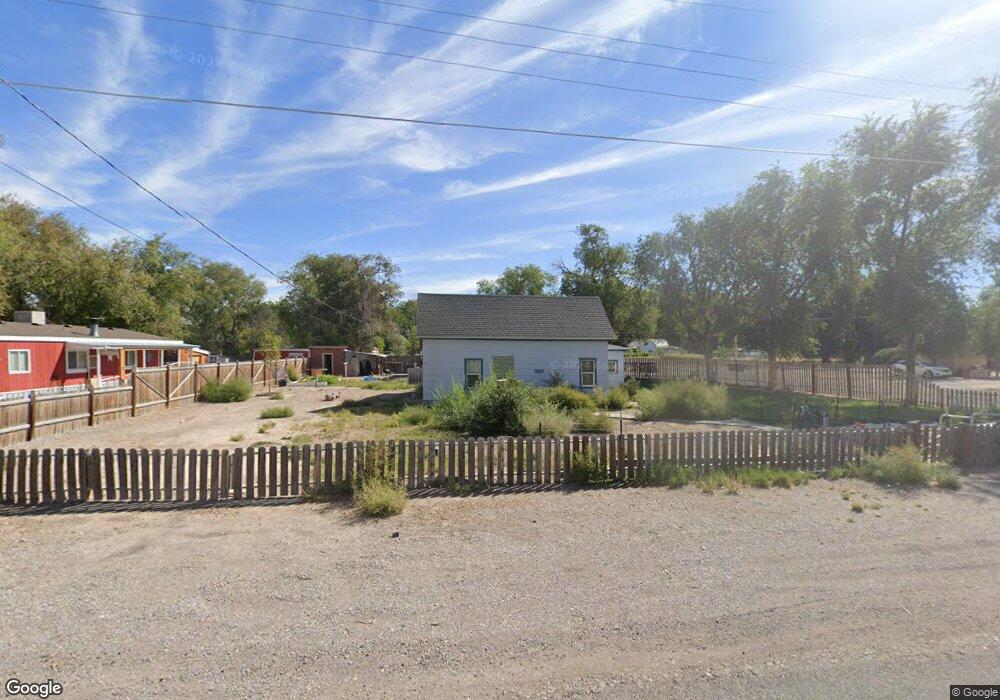
420 N 100 E Hinckley, UT 84635
Estimated Value: $184,000 - $269,000
3
Beds
1
Bath
1,064
Sq Ft
$213/Sq Ft
Est. Value
About This Home
This home is located at 420 N 100 E, Hinckley, UT 84635 and is currently estimated at $226,500, approximately $212 per square foot. 420 N 100 E is a home located in Millard County.
Ownership History
Date
Name
Owned For
Owner Type
Purchase Details
Closed on
Nov 12, 2008
Sold by
Poole Lyle and Sessions Allison
Bought by
Sessions Allison
Current Estimated Value
Purchase Details
Closed on
Jul 11, 2006
Sold by
Hunsaker Carol T
Bought by
Poole Allison M and Poole Lyle G
Home Financials for this Owner
Home Financials are based on the most recent Mortgage that was taken out on this home.
Original Mortgage
$35,100
Interest Rate
6.57%
Mortgage Type
New Conventional
Purchase Details
Closed on
Jul 6, 2006
Sold by
Bishop Craig W and Jakusz Gwen Bishop
Bought by
Hunsaker Carol T
Home Financials for this Owner
Home Financials are based on the most recent Mortgage that was taken out on this home.
Original Mortgage
$35,100
Interest Rate
6.57%
Mortgage Type
New Conventional
Create a Home Valuation Report for This Property
The Home Valuation Report is an in-depth analysis detailing your home's value as well as a comparison with similar homes in the area
Home Values in the Area
Average Home Value in this Area
Purchase History
| Date | Buyer | Sale Price | Title Company |
|---|---|---|---|
| Sessions Allison | -- | -- | |
| Poole Allison M | -- | -- | |
| Hunsaker Carol T | -- | -- |
Source: Public Records
Mortgage History
| Date | Status | Borrower | Loan Amount |
|---|---|---|---|
| Previous Owner | Poole Allison M | $35,100 |
Source: Public Records
Tax History Compared to Growth
Tax History
| Year | Tax Paid | Tax Assessment Tax Assessment Total Assessment is a certain percentage of the fair market value that is determined by local assessors to be the total taxable value of land and additions on the property. | Land | Improvement |
|---|---|---|---|---|
| 2025 | $753 | $89,693 | $14,622 | $75,071 |
| 2024 | $753 | $56,225 | $5,717 | $50,508 |
| 2023 | $868 | $56,225 | $5,717 | $50,508 |
| 2022 | $405 | $34,108 | $5,198 | $28,910 |
| 2021 | $330 | $26,495 | $4,331 | $22,164 |
| 2020 | $286 | $22,944 | $4,125 | $18,819 |
| 2019 | $284 | $22,944 | $4,125 | $18,819 |
| 2018 | $277 | $22,944 | $4,125 | $18,819 |
| 2017 | $281 | $22,395 | $4,125 | $18,270 |
| 2016 | $269 | $22,395 | $4,125 | $18,270 |
| 2015 | $290 | $24,072 | $4,125 | $19,947 |
| 2014 | -- | $24,072 | $4,125 | $19,947 |
| 2013 | -- | $23,491 | $4,125 | $19,366 |
Source: Public Records
Map
Nearby Homes
- 168 N 100 Rd W
- 6500 W 2000 S
- 289 W Center St S
- 1040 W Center St
- 700 Acres
- 1500 S 10000 W
- 6000 N 10000 W
- 700 Acres Hwy 6 & Main St (Hwy 50)
- 2000 E 10500 N
- 6200 S 3000 W
- 3480 S 4000 W
- 3770 S 4000 Rd W
- 0 Tbd 3000 Rd S Unit LotWP001
- 6177 S 3000 Rd W
- 17000 W 2500 Rd S
- 16700 W 2500 South Rd
- 16800 W 2500 South Rd
- 3885 W 4500 S
- 470 S 2750 W Unit 6
- 460 S 2750 W Unit 7