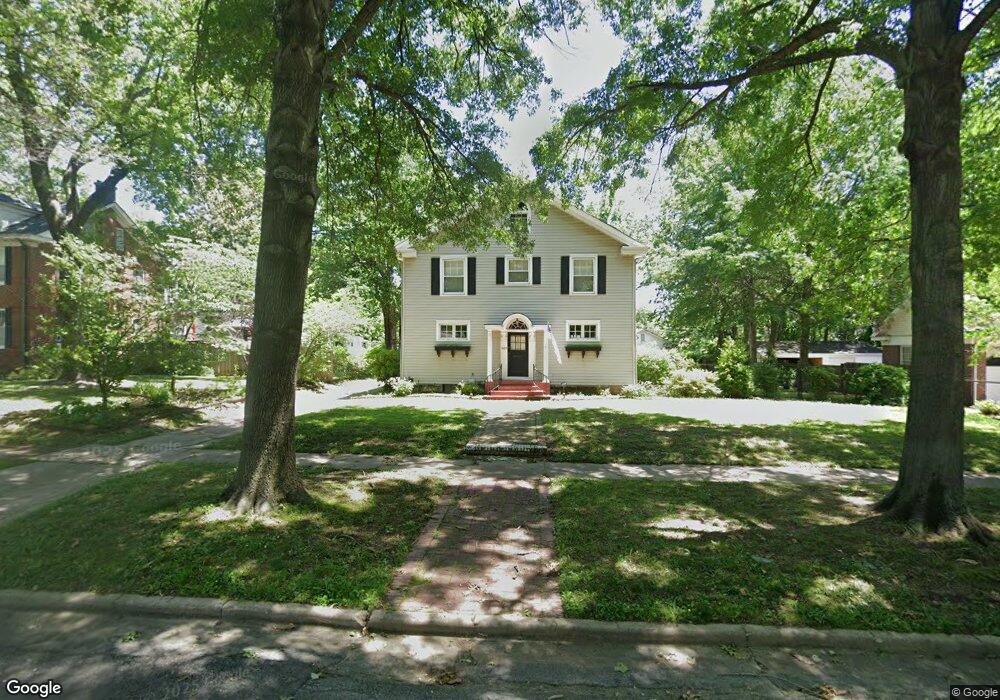
420 N 16th St Muskogee, OK 74401
Central Muskogee NeighborhoodEstimated Value: $141,223 - $169,000
4
Beds
3
Baths
2,530
Sq Ft
$63/Sq Ft
Est. Value
About This Home
This home is located at 420 N 16th St, Muskogee, OK 74401 and is currently estimated at $158,556, approximately $62 per square foot. 420 N 16th St is a home located in Muskogee County with nearby schools including Benjamin Franklin Science Academy, 8th & 9th Grade Academy @ Alice Robertson, and Muskogee High School.
Ownership History
Date
Name
Owned For
Owner Type
Purchase Details
Closed on
Nov 1, 2016
Sold by
Gaden Nancy
Bought by
Gaden John F
Current Estimated Value
Purchase Details
Closed on
Oct 25, 2002
Bought by
Gaden John F and Gaden Nancy E
Purchase Details
Closed on
Jul 8, 1994
Purchase Details
Closed on
Jan 20, 1994
Create a Home Valuation Report for This Property
The Home Valuation Report is an in-depth analysis detailing your home's value as well as a comparison with similar homes in the area
Home Values in the Area
Average Home Value in this Area
Purchase History
| Date | Buyer | Sale Price | Title Company |
|---|---|---|---|
| Gaden John F | -- | None Available | |
| Gaden John F | $139,000 | -- | |
| -- | $58,000 | -- | |
| -- | -- | -- |
Source: Public Records
Tax History Compared to Growth
Tax History
| Year | Tax Paid | Tax Assessment Tax Assessment Total Assessment is a certain percentage of the fair market value that is determined by local assessors to be the total taxable value of land and additions on the property. | Land | Improvement |
|---|---|---|---|---|
| 2025 | $1,115 | $11,306 | $825 | $10,481 |
| 2024 | $1,115 | $11,229 | $825 | $10,404 |
| 2023 | $1,115 | $15,808 | $660 | $15,148 |
| 2022 | $1,476 | $15,808 | $660 | $15,148 |
| 2021 | $1,482 | $15,808 | $660 | $15,148 |
| 2020 | $1,485 | $15,808 | $660 | $15,148 |
| 2019 | $1,427 | $15,349 | $660 | $14,689 |
| 2018 | $1,398 | $15,349 | $660 | $14,689 |
| 2017 | $1,352 | $15,348 | $660 | $14,688 |
| 2016 | $1,367 | $15,348 | $660 | $14,688 |
| 2015 | $1,378 | $15,348 | $660 | $14,688 |
| 2014 | $1 | $15,348 | $660 | $14,688 |
Source: Public Records
Map
Nearby Homes
- 0 15th Unit 2548143
- 1420 W Broadway St
- 535 N 17th St
- 1324 W Broadway St
- 109 N 16th St
- 0 Court St
- 2026 Court St
- 425 N 11th St
- 304 N 11th St
- 1320 Boston St
- 542 N 11th St
- 2118 Court St
- 1620 Lenapah St
- 2131 Topeka St
- 0 N 23rd St
- 1509 Columbus St
- 0 N 10th St
- 2116 Columbus Ave
- 1110 Boston St
- 233 S 13th St