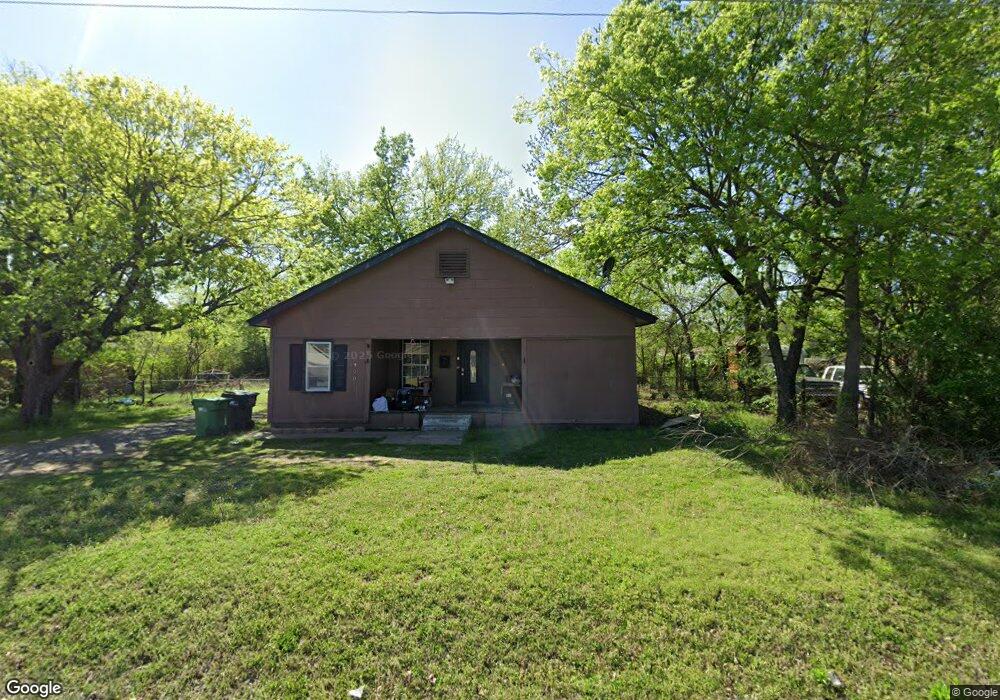
420 N Hodge St Sapulpa, OK 74066
Estimated Value: $86,000 - $148,000
2
Beds
1
Bath
1,092
Sq Ft
$110/Sq Ft
Est. Value
About This Home
This home is located at 420 N Hodge St, Sapulpa, OK 74066 and is currently estimated at $119,730, approximately $109 per square foot. 420 N Hodge St is a home located in Creek County with nearby schools including Sapulpa Junior High School, Sapulpa Middle School, and Sapulpa High School.
Ownership History
Date
Name
Owned For
Owner Type
Purchase Details
Closed on
Jun 9, 2022
Sold by
Michael Tyler Derrick and Lynn Kerri
Bought by
Matney James and Matney Taletha
Current Estimated Value
Home Financials for this Owner
Home Financials are based on the most recent Mortgage that was taken out on this home.
Original Mortgage
$68,732
Outstanding Balance
$65,205
Interest Rate
5.1%
Mortgage Type
FHA
Estimated Equity
$54,525
Purchase Details
Closed on
Jun 11, 2008
Sold by
Bennett Jerry D and Bennett Mary Ann
Bought by
Tyler Derrick Michael and Tyler Kerri Lynn
Home Financials for this Owner
Home Financials are based on the most recent Mortgage that was taken out on this home.
Original Mortgage
$61,941
Interest Rate
6.07%
Mortgage Type
Unknown
Create a Home Valuation Report for This Property
The Home Valuation Report is an in-depth analysis detailing your home's value as well as a comparison with similar homes in the area
Home Values in the Area
Average Home Value in this Area
Purchase History
| Date | Buyer | Sale Price | Title Company |
|---|---|---|---|
| Matney James | $70,000 | None Listed On Document | |
| Tyler Derrick Michael | $52,000 | None Available |
Source: Public Records
Mortgage History
| Date | Status | Borrower | Loan Amount |
|---|---|---|---|
| Open | Matney James | $68,732 | |
| Previous Owner | Tyler Derrick Michael | $61,941 |
Source: Public Records
Tax History Compared to Growth
Tax History
| Year | Tax Paid | Tax Assessment Tax Assessment Total Assessment is a certain percentage of the fair market value that is determined by local assessors to be the total taxable value of land and additions on the property. | Land | Improvement |
|---|---|---|---|---|
| 2025 | $772 | $7,567 | $3,246 | $4,321 |
| 2024 | $772 | $7,347 | $2,280 | $5,067 |
| 2023 | $772 | $8,400 | $2,189 | $6,211 |
| 2022 | $769 | $6,691 | $2,280 | $4,411 |
| 2021 | $756 | $6,372 | $2,280 | $4,092 |
| 2020 | $748 | $6,337 | $2,280 | $4,057 |
| 2019 | $798 | $6,728 | $2,264 | $4,464 |
| 2018 | $775 | $6,408 | $1,577 | $4,831 |
| 2017 | $771 | $6,408 | $1,577 | $4,831 |
| 2016 | $733 | $6,408 | $1,577 | $4,831 |
| 2015 | -- | $6,408 | $1,577 | $4,831 |
| 2014 | -- | $6,408 | $1,577 | $4,831 |
Source: Public Records
Map
Nearby Homes
- 505 N Ross St
- 1411 E Denton Ave
- 543 N Ridgeway St
- 1137 E Perkins Ave
- 103 Woodview Ln
- 1136 E Watchorn Ave
- 1136 E Mcleod Ave
- 1140 E Hobson Ave
- 1137 E Watchorn Ave
- 1002 E Line Ave
- 758 N Moccasin Place
- 420 Shadow Ln
- 6 Mayfield St
- 802 N Boyd Cir
- 436 Foxwood Dr
- 1033 E Thompson Ave
- 1023 E Thompson Ave
- 1001 E Thompson Ave
- 1010 E Thompson Ave
- 930 N Brown St