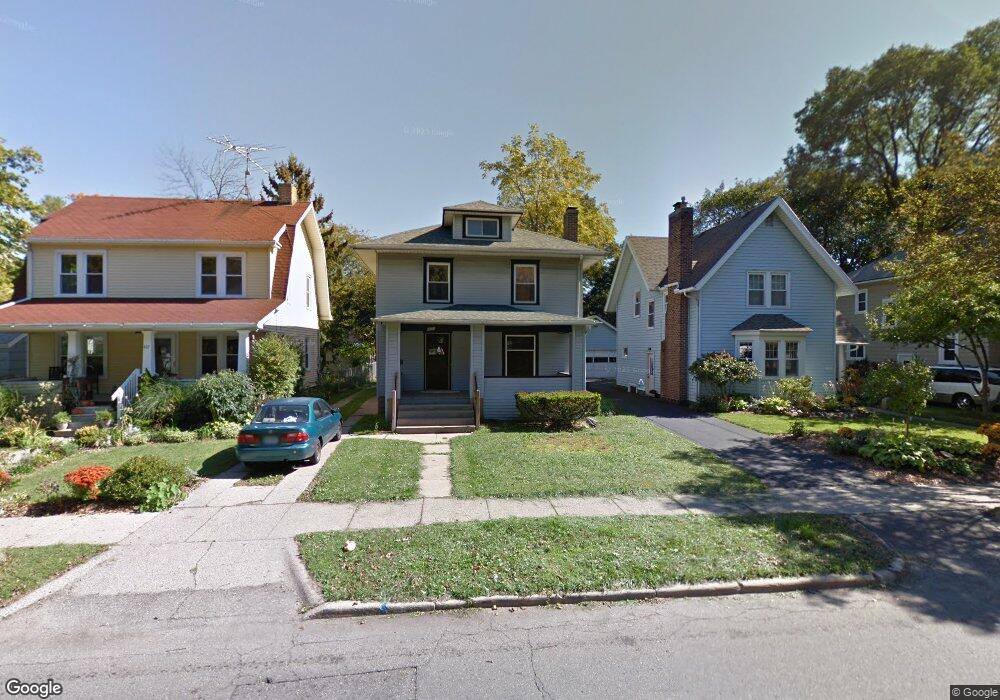
420 N Jenison Ave Lansing, MI 48915
Westside NeighborhoodEstimated Value: $163,395 - $189,000
3
Beds
2
Baths
1,456
Sq Ft
$121/Sq Ft
Est. Value
About This Home
This home is located at 420 N Jenison Ave, Lansing, MI 48915 and is currently estimated at $176,099, approximately $120 per square foot. 420 N Jenison Ave is a home located in Ingham County with nearby schools including Riddle Elementary School, Pattengill Academy, and J.W. Sexton High School.
Ownership History
Date
Name
Owned For
Owner Type
Purchase Details
Closed on
Mar 14, 2024
Sold by
Parker Leon G
Bought by
Parker Family Trust and Parker
Current Estimated Value
Purchase Details
Closed on
Oct 29, 2008
Sold by
Wells Fargo Bank Na
Bought by
Parker Leon G
Purchase Details
Closed on
Jul 24, 2008
Sold by
Wells Fargo Bank Na
Bought by
Wells Fargo Bank Na
Purchase Details
Closed on
Feb 28, 2008
Sold by
Brown Sandra Y
Bought by
Wells Fargo Bank Na
Purchase Details
Closed on
May 20, 2002
Sold by
Brown Brooks Wyvonne and Brown Wyvonne
Bought by
Brown Sandra Y
Home Financials for this Owner
Home Financials are based on the most recent Mortgage that was taken out on this home.
Original Mortgage
$80,000
Interest Rate
6.93%
Create a Home Valuation Report for This Property
The Home Valuation Report is an in-depth analysis detailing your home's value as well as a comparison with similar homes in the area
Home Values in the Area
Average Home Value in this Area
Purchase History
| Date | Buyer | Sale Price | Title Company |
|---|---|---|---|
| Parker Family Trust | -- | None Listed On Document | |
| Parker Leon G | $46,650 | Fidelity National Title | |
| Wells Fargo Bank Na | -- | None Available | |
| Wells Fargo Bank Na | $120,185 | None Available | |
| Brown Sandra Y | $108,000 | Fidelity National Title Ins |
Source: Public Records
Mortgage History
| Date | Status | Borrower | Loan Amount |
|---|---|---|---|
| Previous Owner | Brown Sandra Y | $80,000 |
Source: Public Records
Tax History Compared to Growth
Tax History
| Year | Tax Paid | Tax Assessment Tax Assessment Total Assessment is a certain percentage of the fair market value that is determined by local assessors to be the total taxable value of land and additions on the property. | Land | Improvement |
|---|---|---|---|---|
| 2025 | $3,346 | $73,900 | $5,100 | $68,800 |
| 2024 | $28 | $60,300 | $5,100 | $55,200 |
| 2023 | $3,148 | $56,800 | $5,100 | $51,700 |
| 2022 | $2,874 | $53,500 | $6,200 | $47,300 |
| 2021 | $2,807 | $50,100 | $6,000 | $44,100 |
| 2020 | $2,787 | $45,200 | $6,000 | $39,200 |
| 2019 | $2,694 | $39,600 | $6,000 | $33,600 |
| 2018 | $2,554 | $37,800 | $6,000 | $31,800 |
| 2017 | $2,458 | $37,800 | $6,000 | $31,800 |
| 2016 | $2,454 | $34,500 | $6,000 | $28,500 |
| 2015 | $2,454 | $32,000 | $12,000 | $20,000 |
| 2014 | $2,454 | $32,800 | $18,000 | $14,800 |
Source: Public Records
Map
Nearby Homes
- 425 N Jenison Ave
- 1313 S Genesee Dr
- 518 N Jenison Ave
- 1528 W Shiawassee St
- 314 Memphis St
- 1632 Inverness Ave
- 1812 S Genesee Dr
- 1314 W Ottawa St
- 1229 W Saginaw St
- 1225 W Saginaw St
- 1221 W Saginaw St
- 1217 W Saginaw St
- 418 N Martin Luther King Junior Blvd
- 422 N Martin Luther King Junior Blvd
- 416 N Martin Luther King Junior Blvd
- 1017 W Genesee St
- 1232 W Michigan Ave
- 751 Westmoreland Ave
- 1319 W Michigan Ave
- 1233 W Michigan Ave
- 414 N Jenison Ave
- 422 N Jenison Ave
- 412 N Jenison Ave
- 423 Westmoreland Ave
- 1415 S Genesee Dr
- 421 Westmoreland Ave
- 1411 S Genesee Dr
- 430 N Jenison Ave
- 417 Westmoreland Ave
- 413 Westmoreland Ave
- 427 Westmoreland Ave
- 1414 W Shiawassee St
- 417 N Jenison Ave
- 402 N Jenison Ave
- 1410 W Shiawassee St
- 1407 S Genesee Dr
- 411 Westmoreland Ave
- 421 N Jenison Ave
- 407 Westmoreland Ave