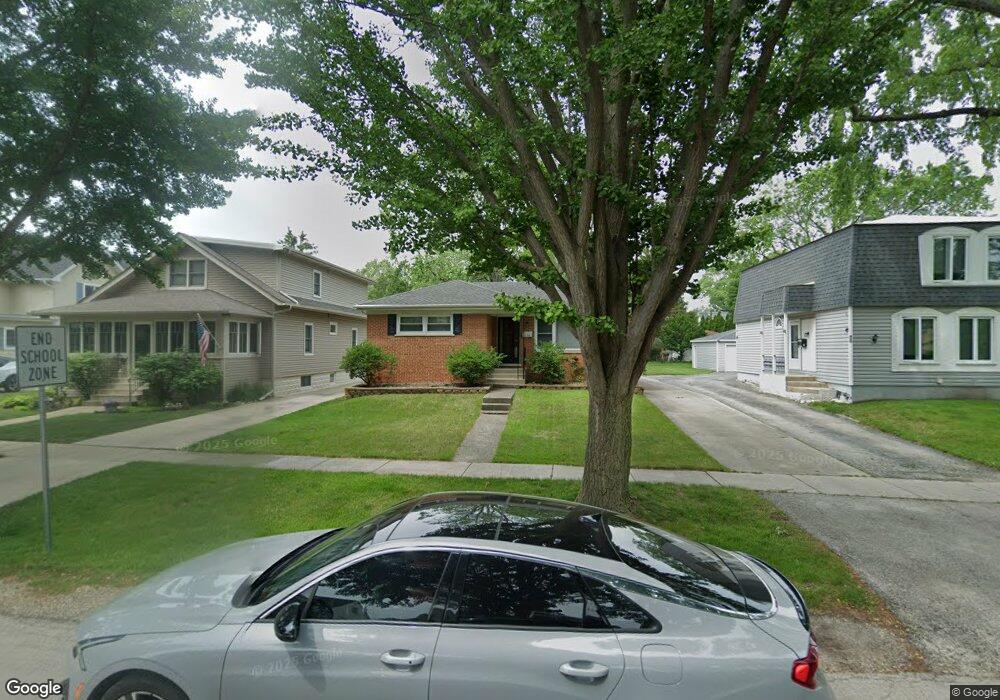
420 N Rush St Itasca, IL 60143
North Itasca NeighborhoodEstimated Value: $305,623 - $404,000
Studio
--
Bath
988
Sq Ft
$369/Sq Ft
Est. Value
About This Home
This home is located at 420 N Rush St, Itasca, IL 60143 and is currently estimated at $364,656, approximately $369 per square foot. 420 N Rush St is a home located in DuPage County with nearby schools including Raymond Benson Primary School, Elmer H Franzen Intermediate School, and F.E. Peacock Middle School.
Ownership History
Date
Name
Owned For
Owner Type
Purchase Details
Closed on
Dec 22, 2022
Sold by
Helsper Thomas M
Bought by
Helsper Susan M
Current Estimated Value
Purchase Details
Closed on
Oct 31, 1995
Sold by
Wojtowicz Adam and Wojtowicz Sharon A
Bought by
Helsper Thomas M
Home Financials for this Owner
Home Financials are based on the most recent Mortgage that was taken out on this home.
Original Mortgage
$117,587
Interest Rate
7.61%
Mortgage Type
FHA
Create a Home Valuation Report for This Property
The Home Valuation Report is an in-depth analysis detailing your home's value as well as a comparison with similar homes in the area
Home Values in the Area
Average Home Value in this Area
Purchase History
| Date | Buyer | Sale Price | Title Company |
|---|---|---|---|
| Helsper Susan M | -- | -- | |
| Helsper Thomas M | $145,000 | -- |
Source: Public Records
Mortgage History
| Date | Status | Borrower | Loan Amount |
|---|---|---|---|
| Previous Owner | Helsper Thomas M | $117,587 |
Source: Public Records
Tax History
| Year | Tax Paid | Tax Assessment Tax Assessment Total Assessment is a certain percentage of the fair market value that is determined by local assessors to be the total taxable value of land and additions on the property. | Land | Improvement |
|---|---|---|---|---|
| 2024 | $5,387 | $102,579 | $57,914 | $44,665 |
| 2023 | $5,645 | $94,300 | $53,240 | $41,060 |
| 2022 | $6,035 | $90,540 | $50,960 | $39,580 |
| 2021 | $5,733 | $86,720 | $48,810 | $37,910 |
| 2020 | $5,510 | $83,060 | $46,750 | $36,310 |
| 2019 | $5,376 | $79,860 | $44,950 | $34,910 |
| 2018 | $5,542 | $79,870 | $44,950 | $34,920 |
| 2017 | $5,205 | $76,330 | $42,960 | $33,370 |
| 2016 | $5,024 | $70,470 | $39,660 | $30,810 |
| 2015 | $4,862 | $65,100 | $36,640 | $28,460 |
| 2014 | $4,642 | $59,710 | $32,980 | $26,730 |
| 2013 | $4,374 | $60,930 | $33,650 | $27,280 |
Source: Public Records
Map
Nearby Homes
- 711 E Greenview Rd
- 100 S Walnut St
- 301 Nicole Way
- 201 Millers Crossing Unit 224
- 259 Millers Crossing Unit 236
- 317 Nicole Way
- 244 Millers Crossing Unit 244
- 312 S Maple St
- 829 Clover Ridge Ln
- 501 S Cherry St
- 206 E George St
- 272 Prospect Ave
- 417 W Pierce Rd
- 21W051 Woodview Dr
- 175 N Clare Ct
- 620 Stone Brook Ct Unit 432
- 1239 Old Mill Ln Unit 401
- 1219 Montego Ct
- 741 Old Creek Ct Unit 793
- 488 W Jason Ln
Your Personal Tour Guide
Ask me questions while you tour the home.