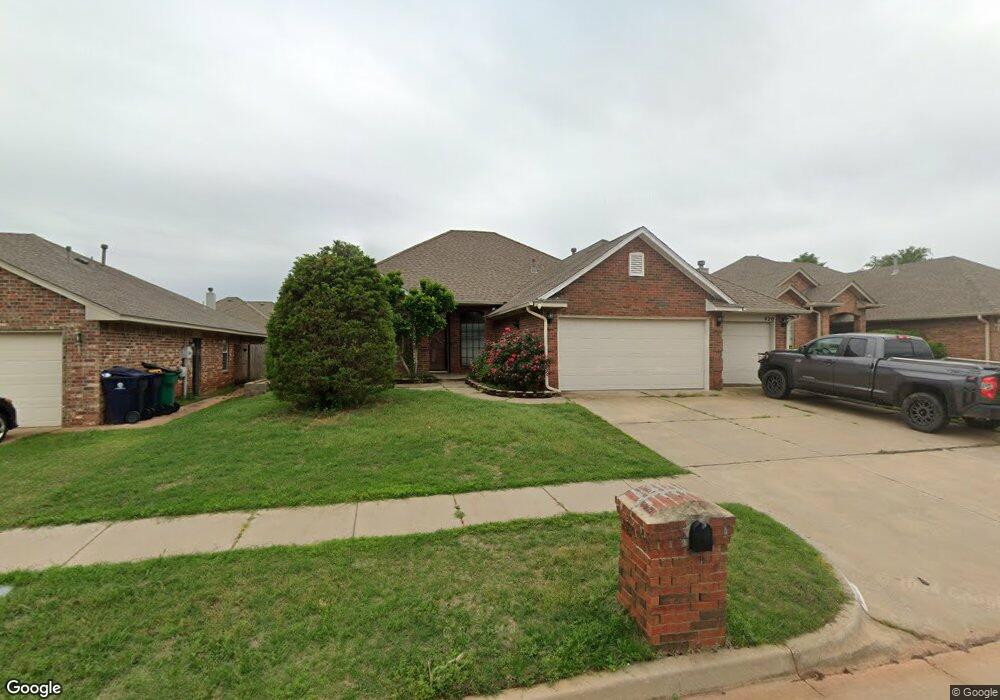
420 NW 140th St Edmond, OK 73013
Fair Hills NeighborhoodEstimated Value: $278,000 - $288,000
4
Beds
2
Baths
1,934
Sq Ft
$146/Sq Ft
Est. Value
About This Home
This home is located at 420 NW 140th St, Edmond, OK 73013 and is currently estimated at $282,163, approximately $145 per square foot. 420 NW 140th St is a home located in Oklahoma County with nearby schools including Charles Haskell Elementary School, Summit Middle School, and Santa Fe High School.
Ownership History
Date
Name
Owned For
Owner Type
Purchase Details
Closed on
Jun 30, 2009
Sold by
Nhin Coung Ke and Nhin Mary Thi Khac
Bought by
Ruan Heqiang and Lin Jinlian
Current Estimated Value
Home Financials for this Owner
Home Financials are based on the most recent Mortgage that was taken out on this home.
Original Mortgage
$147,537
Interest Rate
4.84%
Mortgage Type
FHA
Purchase Details
Closed on
May 26, 2009
Sold by
Nhin Kang
Bought by
Nhin Kang
Home Financials for this Owner
Home Financials are based on the most recent Mortgage that was taken out on this home.
Original Mortgage
$147,537
Interest Rate
4.84%
Mortgage Type
FHA
Purchase Details
Closed on
Aug 7, 2006
Sold by
Ke Cuong and Nhin Mary Thi Khac
Bought by
Stress Less Properties
Purchase Details
Closed on
Apr 15, 1999
Sold by
Grand Valley Properties Inc
Bought by
Nhin Cuong Ke and Nhin Mary Thi Khac
Purchase Details
Closed on
Oct 27, 1998
Sold by
Eddie Quick Mincey L L C
Bought by
Grand Valley Properties Inc
Create a Home Valuation Report for This Property
The Home Valuation Report is an in-depth analysis detailing your home's value as well as a comparison with similar homes in the area
Home Values in the Area
Average Home Value in this Area
Purchase History
| Date | Buyer | Sale Price | Title Company |
|---|---|---|---|
| Ruan Heqiang | $165,000 | The Oklahoma City Abstract & | |
| Nhin Kang | -- | None Available | |
| Stress Less Properties | -- | None Available | |
| Nhin Cuong Ke | $130,500 | -- | |
| Grand Valley Properties Inc | $33,500 | -- |
Source: Public Records
Mortgage History
| Date | Status | Borrower | Loan Amount |
|---|---|---|---|
| Closed | Ruan Heqiang | $147,537 |
Source: Public Records
Tax History Compared to Growth
Tax History
| Year | Tax Paid | Tax Assessment Tax Assessment Total Assessment is a certain percentage of the fair market value that is determined by local assessors to be the total taxable value of land and additions on the property. | Land | Improvement |
|---|---|---|---|---|
| 2024 | $2,773 | $24,467 | $3,094 | $21,373 |
| 2023 | $2,773 | $23,302 | $3,184 | $20,118 |
| 2022 | $2,665 | $22,192 | $3,421 | $18,771 |
| 2021 | $2,513 | $21,136 | $3,589 | $17,547 |
| 2020 | $2,428 | $20,130 | $3,642 | $16,488 |
| 2019 | $2,368 | $19,519 | $3,465 | $16,054 |
| 2018 | $2,269 | $18,590 | $0 | $0 |
| 2017 | $2,349 | $19,359 | $3,600 | $15,759 |
| 2016 | $2,289 | $18,974 | $3,600 | $15,374 |
| 2015 | $2,267 | $18,681 | $3,600 | $15,081 |
| 2014 | $2,285 | $18,879 | $3,600 | $15,279 |
Source: Public Records
Map
Nearby Homes
- 521 NW 138th St
- 704 NW 137th St
- 14509 Oakmond Rd
- 701 NW 141st St
- 716 NW 137th St
- 612 Glenridge Dr
- 817 NW 141st St
- 14705 Longford Way
- 325 NW 146th St
- 816 NW 145th Cir
- 15401 Caspian Ln
- 14812 Maplelake Dr
- 125 NW 147th St
- 508 NW 150th Place
- 1112 NW 140th Terrace
- 15016 Kurdson Way
- 14809 Glenmark Dr
- 14045 Apache Dr
- 15213 Wilford Way
- 204 NW 152nd St
- 416 NW 140th St
- 424 NW 140th St
- 421 NW 139th St
- 428 NW 140th St
- 417 NW 139th St
- 425 NW 139th St
- 429 NW 140th St
- 413 NW 139th St
- 429 NW 139th St
- 425 NW 140th St
- 433 NW 140th St
- 408 NW 140th St
- 421 NW 140th St
- 14101 Glen Oaks Place
- 409 NW 139th St
- 433 NW 139th St
- 417 NW 140th St
- 14108 Glen Oaks Place
- 14109 Glen Oaks Place
- 405 NW 139th St