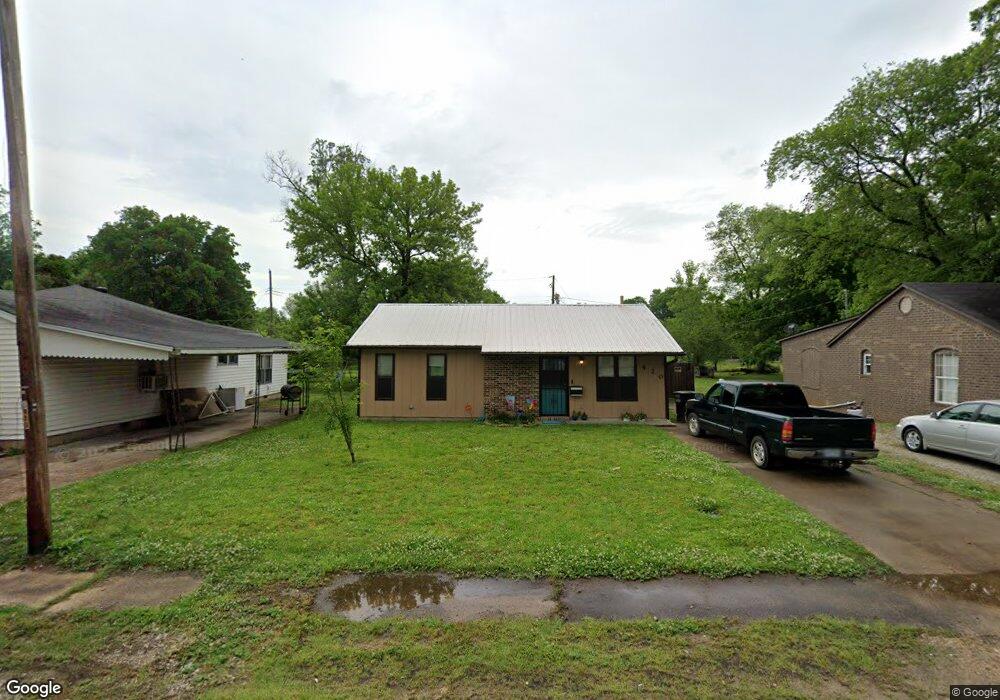
420 Olive St Trumann, AR 72472
Estimated Value: $78,000 - $93,000
Studio
1
Bath
816
Sq Ft
$106/Sq Ft
Est. Value
About This Home
This home is located at 420 Olive St, Trumann, AR 72472 and is currently estimated at $86,707, approximately $106 per square foot. 420 Olive St is a home located in Poinsett County with nearby schools including Trumann Elementary School, Trumann Intermediate School 5-6, and Trumann Middle School.
Ownership History
Date
Name
Owned For
Owner Type
Purchase Details
Closed on
May 31, 2023
Sold by
Cromwell Michael G and Cromwell Tina J
Bought by
Thompson Zachary and Thompson Amanda
Current Estimated Value
Home Financials for this Owner
Home Financials are based on the most recent Mortgage that was taken out on this home.
Original Mortgage
$73,641
Outstanding Balance
$71,593
Interest Rate
6.39%
Mortgage Type
FHA
Estimated Equity
$15,114
Purchase Details
Closed on
Apr 29, 1994
Sold by
Not Provided
Bought by
Cromwell Michael G and Cromwell Tina J
Create a Home Valuation Report for This Property
The Home Valuation Report is an in-depth analysis detailing your home's value as well as a comparison with similar homes in the area
Home Values in the Area
Average Home Value in this Area
Purchase History
| Date | Buyer | Sale Price | Title Company |
|---|---|---|---|
| Thompson Zachary | $75,000 | None Listed On Document | |
| Cromwell Michael G | $25,000 | -- |
Source: Public Records
Mortgage History
| Date | Status | Borrower | Loan Amount |
|---|---|---|---|
| Open | Thompson Zachary | $73,641 |
Source: Public Records
Tax History
| Year | Tax Paid | Tax Assessment Tax Assessment Total Assessment is a certain percentage of the fair market value that is determined by local assessors to be the total taxable value of land and additions on the property. | Land | Improvement |
|---|---|---|---|---|
| 2025 | $374 | $7,700 | $640 | $7,060 |
| 2024 | $374 | $7,700 | $640 | $7,060 |
| 2023 | $402 | $7,700 | $640 | $7,060 |
| 2022 | $369 | $7,700 | $640 | $7,060 |
| 2021 | $337 | $6,420 | $400 | $6,020 |
| 2020 | $337 | $6,420 | $400 | $6,020 |
| 2019 | $337 | $6,420 | $400 | $6,020 |
| 2018 | $337 | $6,420 | $400 | $6,020 |
| 2017 | $294 | $6,420 | $400 | $6,020 |
| 2016 | $352 | $7,690 | $500 | $7,190 |
| 2015 | $352 | $7,690 | $500 | $7,190 |
| 2014 | $352 | $7,690 | $500 | $7,190 |
Source: Public Records
Map
Nearby Homes
- 504 Locust Ave
- 353 Holly Ave
- 514 Maple St
- 615 W Main St
- 526 Maple St
- 39 W Main St
- 39.10 Acres W Main St Unit 39.10 Acres West Mai
- 329 Sharon Dr
- 149 Rosewood Dr
- 153 S Parkview Dr
- 145 S Parkview Dr
- 213 Melrose Dr
- 1117 Mulberry Dr
- 1201 Mulberry Dr
- 120 E Speedway St
- 1200 Mulberry Dr
- 517 Butterfield Ave
- 532 Smith St
- 115 N Crest
- 115 N Crest Ave
Your Personal Tour Guide
Ask me questions while you tour the home.