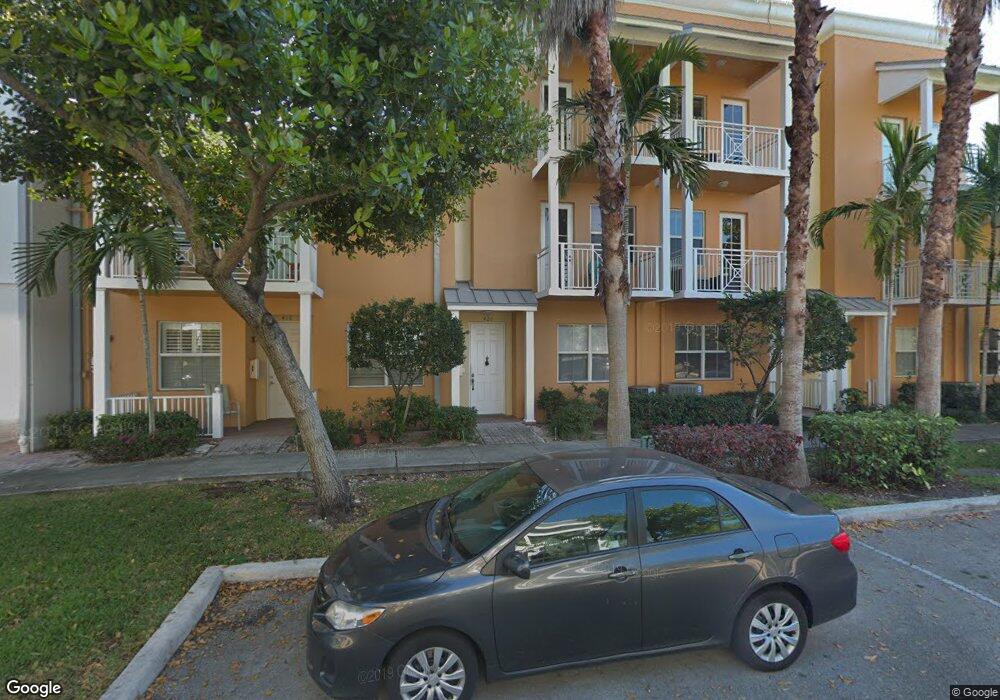
420 Olssen Ave Unit 420 Fort Lauderdale, FL 33312
Sailboat Bend Neighborhood
4
Beds
4
Baths
2,583
Sq Ft
--
Built
About This Home
This home is located at 420 Olssen Ave Unit 420, Fort Lauderdale, FL 33312. 420 Olssen Ave Unit 420 is a home located in Broward County with nearby schools including New River Middle School, Stranahan High School, and South Florida Montessori Academy.
Ownership History
Date
Name
Owned For
Owner Type
Purchase Details
Closed on
May 1, 2025
Sold by
Quinn Phillip
Bought by
Pelosi Melissa Rae and Pelosi Alexander Robert
Home Financials for this Owner
Home Financials are based on the most recent Mortgage that was taken out on this home.
Original Mortgage
$489,900
Outstanding Balance
$487,293
Interest Rate
6.67%
Mortgage Type
New Conventional
Purchase Details
Closed on
Feb 4, 2020
Sold by
Schwartz Helene B and Schwartz Cohen Helene B
Bought by
Quinn Phillip
Home Financials for this Owner
Home Financials are based on the most recent Mortgage that was taken out on this home.
Original Mortgage
$304,000
Interest Rate
3.72%
Mortgage Type
New Conventional
Purchase Details
Closed on
Jan 30, 2006
Sold by
Lennar Homes Inc
Bought by
Cohen Jay L and Schwartz Helene B
Home Financials for this Owner
Home Financials are based on the most recent Mortgage that was taken out on this home.
Original Mortgage
$74,950
Interest Rate
6.14%
Mortgage Type
Credit Line Revolving
Create a Home Valuation Report for This Property
The Home Valuation Report is an in-depth analysis detailing your home's value as well as a comparison with similar homes in the area
Home Values in the Area
Average Home Value in this Area
Purchase History
| Date | Buyer | Sale Price | Title Company |
|---|---|---|---|
| Pelosi Melissa Rae | $544,900 | Capital Abstract & Title | |
| Quinn Phillip | $320,000 | Attorney | |
| Cohen Jay L | $500,000 | North American Title Co |
Source: Public Records
Mortgage History
| Date | Status | Borrower | Loan Amount |
|---|---|---|---|
| Open | Pelosi Melissa Rae | $489,900 | |
| Previous Owner | Quinn Phillip | $304,000 | |
| Previous Owner | Cohen Jay L | $74,950 | |
| Previous Owner | Cohen Jay L | $399,900 |
Source: Public Records
Tax History Compared to Growth
Tax History
| Year | Tax Paid | Tax Assessment Tax Assessment Total Assessment is a certain percentage of the fair market value that is determined by local assessors to be the total taxable value of land and additions on the property. | Land | Improvement |
|---|---|---|---|---|
| 2025 | $10,464 | $531,510 | $53,150 | $478,360 |
| 2024 | $5,682 | $531,510 | $53,150 | $478,360 |
| 2023 | $5,682 | $312,280 | $0 | $0 |
| 2022 | $5,386 | $303,190 | $0 | $0 |
| 2021 | $5,226 | $294,360 | $29,440 | $264,920 |
| 2020 | $7,075 | $354,640 | $35,460 | $319,180 |
| 2019 | $6,638 | $341,220 | $34,120 | $307,100 |
| 2018 | $6,134 | $350,780 | $35,080 | $315,700 |
| 2017 | $5,753 | $281,000 | $0 | $0 |
| 2016 | $5,819 | $255,460 | $0 | $0 |
| 2015 | $6,097 | $232,240 | $0 | $0 |
| 2014 | $5,461 | $211,130 | $0 | $0 |
| 2013 | -- | $191,940 | $19,190 | $172,750 |
Source: Public Records
Map
Nearby Homes
- 1246 SW 4th St
- 357 SW 13th Terrace Unit 357
- 312 SW 14th Ave
- 1512 SW 5th St Unit Dock
- 1501 SW 4th Ct
- 1332 SW 2nd Ct
- 351 SW 14th Way
- 1023 W Las Olas Blvd
- 401 SW 14th Ave
- 1208 SW 2nd Ct
- 615 SW 14th Ave
- 232 Seminole Ave
- 1115 SW 5th Place
- 1505 SW 5th Place
- 623 SW 12th Ave
- 1608 SW 5th Ct
- 621 SW 14th Terrace
- 628 SW 14th Terrace
- 620 SW 12th Ave
- 637 SW 12th Ave
- 420 SW 13th Terrace Unit 420
- 416 SW 13th Terrace Unit 416
- 424 Olssen Ave Unit 424
- 428 SW 13th Terrace Unit 428
- 414 Olssen Ave
- 432 SW 13th Terrace Unit 432
- 410 SW 13th Terrace Unit 410
- 404 SW 13th Terrace Unit 245
- 414 SW 13th Terrace
- 402 SW 13th Terrace Unit 402
- 404 SW 13th Terrace Unit 404
- 1310 SW 4th St Unit 1310
- 1312 SW 4th St Unit 1312
- 412 SW 13th Terrace Unit 412
- 410 SW 13th Terrace Unit 410
- 414 SW 13th Terrace
- 410 13th Ave
- 1304 SW 4th St Unit 1304
- 408 SW 13th Terrace Unit 408
- 408 SW 13th Terrace Unit 408