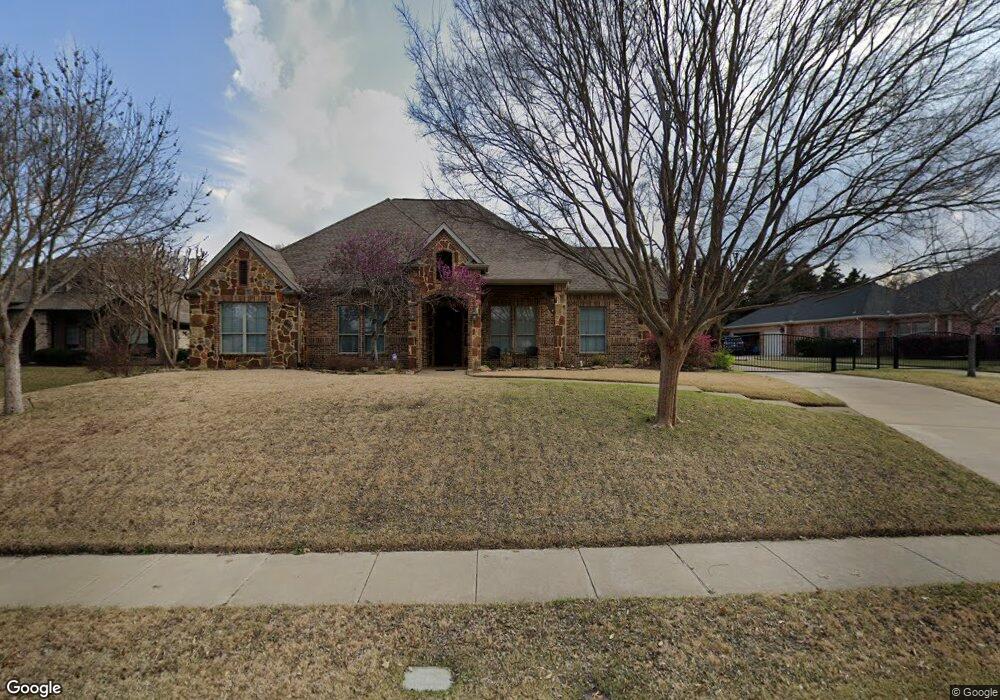
420 Pleasant Run Murphy, TX 75094
Estimated Value: $690,000 - $812,029
4
Beds
3
Baths
3,349
Sq Ft
$220/Sq Ft
Est. Value
About This Home
This home is located at 420 Pleasant Run, Murphy, TX 75094 and is currently estimated at $737,757, approximately $220 per square foot. 420 Pleasant Run is a home located in Collin County with nearby schools including Don Whitt Elementary School, Dr. Al Draper Intermediate Middle School, and Raymond B Cooper J High School.
Ownership History
Date
Name
Owned For
Owner Type
Purchase Details
Closed on
Jan 28, 2010
Sold by
Bettin Lisa D
Bought by
George John and George Hilary
Current Estimated Value
Home Financials for this Owner
Home Financials are based on the most recent Mortgage that was taken out on this home.
Original Mortgage
$280,000
Outstanding Balance
$184,383
Interest Rate
4.93%
Mortgage Type
New Conventional
Estimated Equity
$553,374
Purchase Details
Closed on
Oct 25, 2002
Sold by
Taylor Ronald Earl and Taylor Dawna Louise
Bought by
Bettin Mark A and Bettin Lisa D
Purchase Details
Closed on
Jul 12, 2001
Sold by
Alexander & Oldner Llc
Bought by
Taylor Ronald Earl and Taylor Dawna Louise
Home Financials for this Owner
Home Financials are based on the most recent Mortgage that was taken out on this home.
Original Mortgage
$48,600
Interest Rate
7.07%
Create a Home Valuation Report for This Property
The Home Valuation Report is an in-depth analysis detailing your home's value as well as a comparison with similar homes in the area
Home Values in the Area
Average Home Value in this Area
Purchase History
| Date | Buyer | Sale Price | Title Company |
|---|---|---|---|
| George John | -- | Hftc | |
| Bettin Mark A | -- | -- | |
| Taylor Ronald Earl | -- | -- |
Source: Public Records
Mortgage History
| Date | Status | Borrower | Loan Amount |
|---|---|---|---|
| Open | George John | $280,000 | |
| Previous Owner | Taylor Ronald Earl | $48,600 |
Source: Public Records
Tax History Compared to Growth
Tax History
| Year | Tax Paid | Tax Assessment Tax Assessment Total Assessment is a certain percentage of the fair market value that is determined by local assessors to be the total taxable value of land and additions on the property. | Land | Improvement |
|---|---|---|---|---|
| 2025 | $9,990 | $695,482 | $160,000 | $655,176 |
| 2024 | $9,990 | $632,256 | $160,000 | $690,784 |
| 2023 | $9,990 | $574,778 | $160,000 | $597,833 |
| 2022 | $10,955 | $522,525 | $140,000 | $567,086 |
| 2021 | $10,470 | $510,945 | $125,000 | $385,945 |
| 2020 | $9,887 | $500,996 | $125,000 | $375,996 |
| 2019 | $9,391 | $392,581 | $110,000 | $363,381 |
| 2018 | $8,608 | $356,892 | $110,000 | $350,257 |
| 2017 | $7,779 | $456,308 | $100,000 | $356,308 |
| 2016 | $7,153 | $406,408 | $85,000 | $321,408 |
| 2015 | $5,800 | $386,293 | $75,000 | $311,293 |
Source: Public Records
Map
Nearby Homes
- 7319 Crane Dr
- 403 Pleasant Run
- 2603 Grant Dr
- 7307 Crane Dr
- 179 Moonlight Dr
- 7022 Cottonwood Cir
- 2911 Tracy Lynn Ln
- 6905 Wilhelmina Dr
- 7010 Cottonwood Cir
- 7117 Abilene Dr
- 2415 Green Meadow Dr
- 7612 Cindy Ln
- 2011 Cori Place
- 813 Burgess Ln
- 2006 Cori Place
- 7706 Paddock Trail
- 6925 Dewitt Rd
- 602 Horizon Dr
- 2720 Ranchview Dr
- 3206 Creekside Dr
- 416 Pleasant Run
- 424 Pleasant Run
- 412 Pleasant Run
- 2204 Ranch Rd
- 2114 Ranch Rd
- 428 Pleasant Run
- 2208 Ranch Rd
- 2110 Ranch Rd
- 417 Pleasant Run
- 2212 Ranch Rd
- 2106 Ranch Rd
- 408 Pleasant Run
- 421 Pleasant Run
- 432 Pleasant Run
- 2306 Ranch Rd
- 1016 Mason Ln
- 413 Pleasant Run
- 2102 Ranch Rd
- 2205 Ranch Rd
- 2111 Ranch Rd