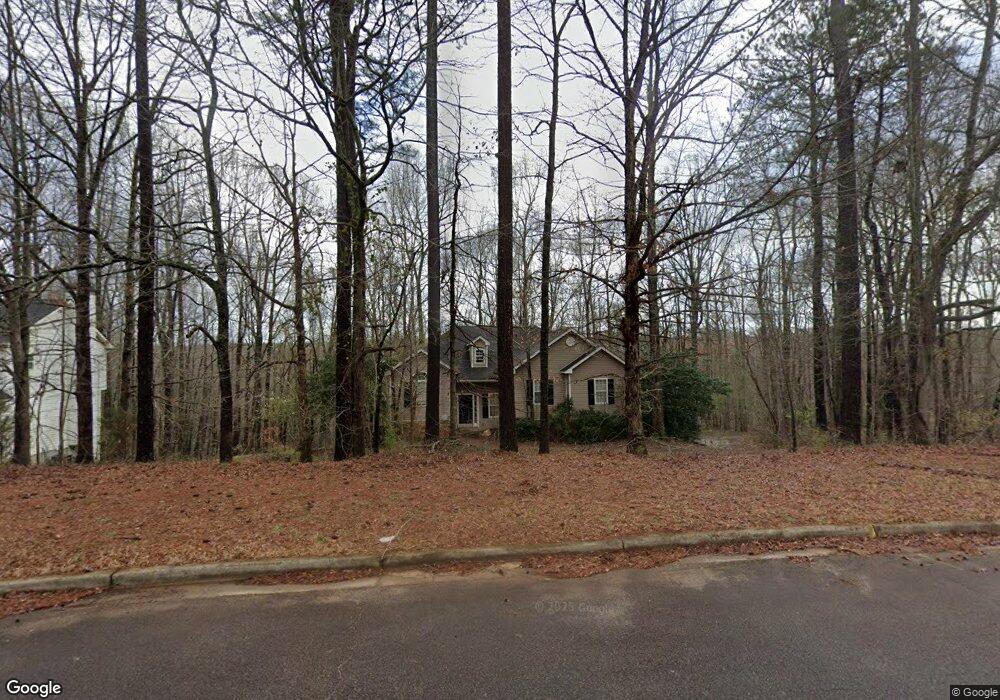
420 Royal St McDonough, GA 30253
Estimated Value: $288,578 - $310,000
3
Beds
3
Baths
1,713
Sq Ft
$175/Sq Ft
Est. Value
About This Home
This home is located at 420 Royal St, McDonough, GA 30253 and is currently estimated at $299,645, approximately $174 per square foot. 420 Royal St is a home located in Henry County with nearby schools including Oakland Elementary School, Luella Middle School, and Luella High School.
Ownership History
Date
Name
Owned For
Owner Type
Purchase Details
Closed on
Sep 15, 2009
Sold by
Hud-Housing Of Urban Dev
Bought by
Bordelon Stephen F
Current Estimated Value
Home Financials for this Owner
Home Financials are based on the most recent Mortgage that was taken out on this home.
Original Mortgage
$87,301
Outstanding Balance
$57,181
Interest Rate
5.22%
Mortgage Type
FHA
Estimated Equity
$242,464
Purchase Details
Closed on
May 6, 2008
Sold by
Countrywide Home Loans Inc
Bought by
Hud-Housing Of Urban Dev
Purchase Details
Closed on
Mar 25, 2002
Sold by
Steve Reeves Hms Inc
Bought by
Kane Jason
Home Financials for this Owner
Home Financials are based on the most recent Mortgage that was taken out on this home.
Original Mortgage
$146,599
Interest Rate
6.89%
Mortgage Type
FHA
Purchase Details
Closed on
Jan 25, 2001
Sold by
Ecs Dev Corp
Bought by
Schafer Steve
Create a Home Valuation Report for This Property
The Home Valuation Report is an in-depth analysis detailing your home's value as well as a comparison with similar homes in the area
Home Values in the Area
Average Home Value in this Area
Purchase History
| Date | Buyer | Sale Price | Title Company |
|---|---|---|---|
| Bordelon Stephen F | -- | -- | |
| Hud-Housing Of Urban Dev | -- | -- | |
| Countrywide Home Loans Inc | $160,515 | -- | |
| Kane Jason | $148,900 | -- | |
| Schafer Steve | -- | -- |
Source: Public Records
Mortgage History
| Date | Status | Borrower | Loan Amount |
|---|---|---|---|
| Open | Bordelon Stephen F | $87,301 | |
| Previous Owner | Kane Jason | $146,599 |
Source: Public Records
Tax History Compared to Growth
Tax History
| Year | Tax Paid | Tax Assessment Tax Assessment Total Assessment is a certain percentage of the fair market value that is determined by local assessors to be the total taxable value of land and additions on the property. | Land | Improvement |
|---|---|---|---|---|
| 2024 | $4,984 | $123,520 | $19,200 | $104,320 |
| 2023 | $5,185 | $133,160 | $16,800 | $116,360 |
| 2022 | $4,067 | $104,040 | $16,800 | $87,240 |
| 2021 | $3,271 | $83,280 | $16,800 | $66,480 |
| 2020 | $2,966 | $75,320 | $12,000 | $63,320 |
| 2019 | $2,752 | $69,760 | $12,000 | $57,760 |
| 2018 | $2,380 | $60,040 | $12,000 | $48,040 |
| 2016 | $2,068 | $51,920 | $9,600 | $42,320 |
| 2015 | $2,307 | $56,400 | $9,600 | $46,800 |
| 2014 | $2,018 | $48,520 | $9,600 | $38,920 |
Source: Public Records
Map
Nearby Homes
- 445 Royal St
- 405 Corricella Ct
- 309 Torcello Blvd
- 1205 Fagiolo St
- 1240 Fagiolo St
- 1212 Fagiolo St
- 1216 Fagiolo St
- 1204 Fagiolo St
- 1213 Fagiolo St
- 317 Torcello Blvd
- 313 Torcello Blvd
- 1220 Fagiolo St
- 1208 Fagiolo St
- 1224 Fagiolo St
- 1236 Fagiolo St
- 1232 Fagiolo St
- 1256 Fagiolo St
- 1260 Fagiolo St
- 1252 Fagiolo St
- 1248 Fagiolo St