Estimated Value: $359,795 - $384,000
3
Beds
1
Bath
2,184
Sq Ft
$170/Sq Ft
Est. Value
About This Home
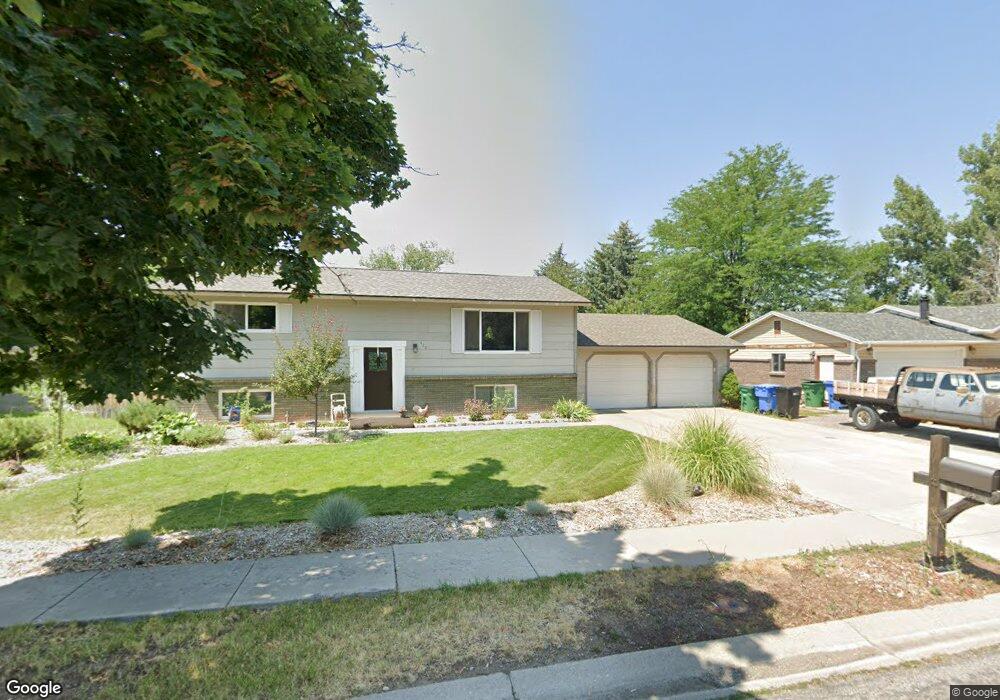
This home is located at 420 S 600 E, Hyrum, UT 84319 and is currently estimated at $370,199, approximately $169 per square foot. 420 S 600 E is a home located in Cache County with nearby schools including Millville School, South Cache Middle School, and Mountain Crest High School.
Ownership History
Date
Name
Owned For
Owner Type
Purchase Details
Closed on
Feb 7, 2018
Sold by
Yonk Joshua J and Williams Teresa
Bought by
Melean Andrew J and Melean Rebecca L
Current Estimated Value
Home Financials for this Owner
Home Financials are based on the most recent Mortgage that was taken out on this home.
Original Mortgage
$168,080
Outstanding Balance
$142,020
Interest Rate
3.99%
Mortgage Type
New Conventional
Estimated Equity
$228,179
Purchase Details
Closed on
Oct 25, 2005
Sold by
Yonk Teresa
Bought by
Williams Teresa
Home Financials for this Owner
Home Financials are based on the most recent Mortgage that was taken out on this home.
Original Mortgage
$40,000
Interest Rate
6.32%
Mortgage Type
Credit Line Revolving
Create a Home Valuation Report for This Property
The Home Valuation Report is an in-depth analysis detailing your home's value as well as a comparison with similar homes in the area
Home Values in the Area
Average Home Value in this Area
Purchase History
| Date | Buyer | Sale Price | Title Company |
|---|---|---|---|
| Melean Andrew J | -- | -- | |
| Williams Teresa | -- | Accommodation |
Source: Public Records
Mortgage History
| Date | Status | Borrower | Loan Amount |
|---|---|---|---|
| Open | Melean Andrew J | $168,080 | |
| Previous Owner | Williams Teresa | $40,000 |
Source: Public Records
Tax History
| Year | Tax Paid | Tax Assessment Tax Assessment Total Assessment is a certain percentage of the fair market value that is determined by local assessors to be the total taxable value of land and additions on the property. | Land | Improvement |
|---|---|---|---|---|
| 2025 | $1,232 | $176,940 | $0 | $0 |
| 2024 | $131 | $176,120 | $0 | $0 |
| 2023 | $1,343 | $172,205 | $0 | $0 |
| 2022 | $1,402 | $172,205 | $0 | $0 |
| 2021 | $1,351 | $255,650 | $64,130 | $191,520 |
| 2020 | $1,260 | $223,730 | $64,130 | $159,600 |
| 2019 | $911 | $152,278 | $41,000 | $111,278 |
| 2018 | $838 | $135,304 | $41,000 | $94,304 |
| 2017 | $822 | $68,860 | $0 | $0 |
| 2016 | $840 | $68,860 | $0 | $0 |
| 2015 | $842 | $68,860 | $0 | $0 |
| 2014 | $775 | $64,815 | $0 | $0 |
| 2013 | -- | $64,815 | $0 | $0 |
Source: Public Records
Map
Nearby Homes
Your Personal Tour Guide
Ask me questions while you tour the home.