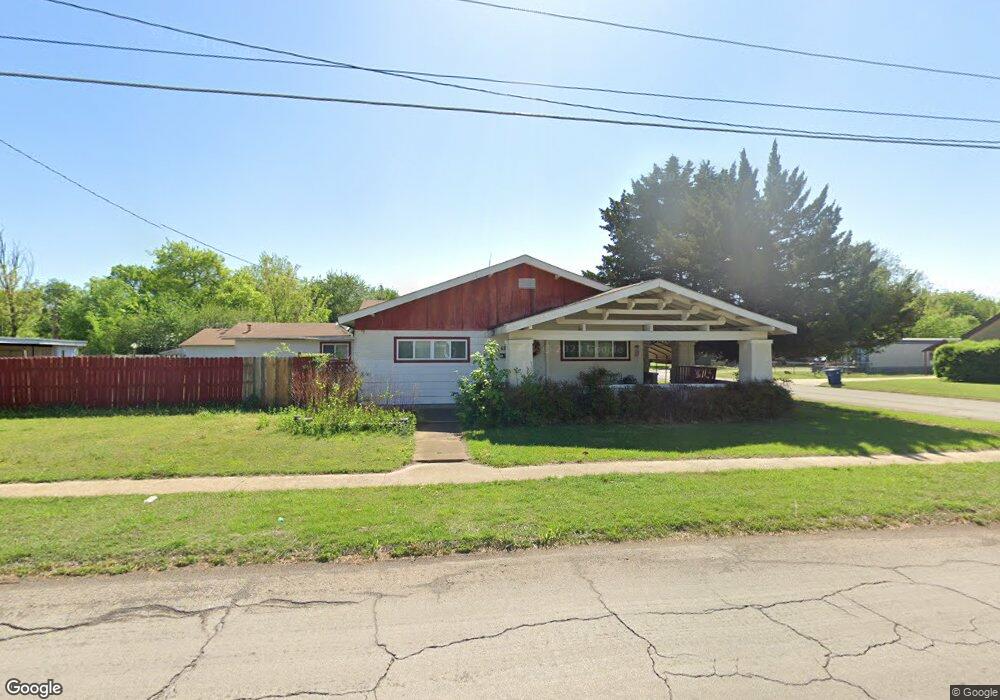
420 S 9th St Duncan, OK 73533
Estimated Value: $72,000 - $80,141
3
Beds
2
Baths
2,107
Sq Ft
$36/Sq Ft
Est. Value
About This Home
This home is located at 420 S 9th St, Duncan, OK 73533 and is currently estimated at $75,535, approximately $35 per square foot. 420 S 9th St is a home located in Stephens County with nearby schools including Emerson Elementary School, Duncan Middle School, and Duncan High School.
Ownership History
Date
Name
Owned For
Owner Type
Purchase Details
Closed on
Apr 26, 2024
Sold by
Collins Walter C
Bought by
Jackson Nathaniel Lee
Current Estimated Value
Home Financials for this Owner
Home Financials are based on the most recent Mortgage that was taken out on this home.
Original Mortgage
$66,930
Outstanding Balance
$65,903
Interest Rate
6.74%
Mortgage Type
New Conventional
Estimated Equity
$9,632
Purchase Details
Closed on
Jun 23, 2016
Sold by
Lanier Jeanine Massey and Lanier Quinn
Bought by
Collins Walter C and Collins Theresa D
Home Financials for this Owner
Home Financials are based on the most recent Mortgage that was taken out on this home.
Original Mortgage
$53,767
Interest Rate
3.57%
Mortgage Type
Future Advance Clause Open End Mortgage
Purchase Details
Closed on
Jan 28, 2015
Sold by
Brown Jeanine Massey and Lanier Jeanine Massey
Bought by
Lanier Jeanine Massey
Create a Home Valuation Report for This Property
The Home Valuation Report is an in-depth analysis detailing your home's value as well as a comparison with similar homes in the area
Home Values in the Area
Average Home Value in this Area
Purchase History
| Date | Buyer | Sale Price | Title Company |
|---|---|---|---|
| Jackson Nathaniel Lee | $69,000 | First American Title | |
| Collins Walter C | $52,500 | None Available | |
| Lanier Jeanine Massey | -- | None Available |
Source: Public Records
Mortgage History
| Date | Status | Borrower | Loan Amount |
|---|---|---|---|
| Open | Jackson Nathaniel Lee | $66,930 | |
| Previous Owner | Collins Walter C | $53,767 |
Source: Public Records
Tax History Compared to Growth
Tax History
| Year | Tax Paid | Tax Assessment Tax Assessment Total Assessment is a certain percentage of the fair market value that is determined by local assessors to be the total taxable value of land and additions on the property. | Land | Improvement |
|---|---|---|---|---|
| 2025 | $649 | $7,693 | $506 | $7,187 |
| 2024 | $518 | $6,083 | $506 | $5,577 |
| 2023 | $518 | $6,083 | $506 | $5,577 |
| 2022 | $469 | $5,793 | $506 | $5,287 |
| 2021 | $469 | $5,517 | $506 | $5,011 |
| 2020 | $432 | $5,005 | $506 | $4,499 |
| 2019 | $457 | $5,284 | $506 | $4,778 |
| 2018 | $486 | $5,455 | $506 | $4,949 |
| 2017 | $504 | $5,859 | $506 | $5,353 |
| 2016 | $449 | $6,285 | $450 | $5,835 |
| 2015 | $401 | $6,102 | $445 | $5,657 |
| 2014 | $401 | $5,925 | $440 | $5,485 |
Source: Public Records
Map
Nearby Homes
- 708 W Pecan Ave
- 0 W Mulberry Ave
- 1240 S 9th St
- 713 713 W Elm Ave
- 1007 S 8th St
- 273787 E 1720 Rd
- 0 W Stephens Ave
- 507 S 13th St
- 711 711 S 12th
- 1309 W Pecan Ave
- 1109 W Stephens Ave
- 1009 W Duncan Ave
- 177277 N 2790 Rd
- 2 5th St Unit Dr
- 451 S 11th St
- 1114 1114 S 10th St
- 1203 W Walnut Ave
- 512 W Oak Ave
- 27 N 14th St
- 1105 W Beech Ave
- 420 420 S 9th St
- 416 S 9th St
- 811 W Mulberry Ave
- 502 S 9th St
- 807 W Mulberry Ave
- 406 S 9th St
- 419 S 9th St
- 413 S 9th St
- 902 W Mulberry Ave
- 805 W Mulberry Ave
- 504 S 9th St
- 812 W Mulberry Ave
- 404 S 9th St
- 411 S 9th St
- 812 W Pecan Ave
- 808 W Mulberry Ave
- 506 S 9th St
- 906 W Mulberry Ave
- 907 W Mulberry Ave
- 814 W Pecan Ave