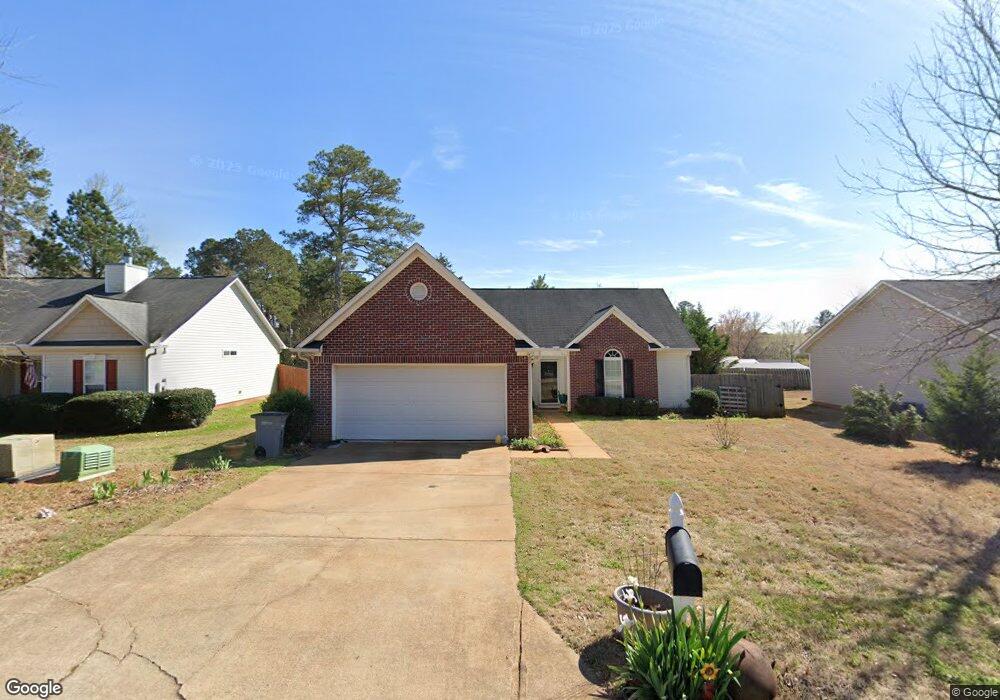
420 S Page St Unit 38 Lagrange, GA 30241
Estimated Value: $213,000 - $228,000
3
Beds
2
Baths
1,372
Sq Ft
$159/Sq Ft
Est. Value
About This Home
This home is located at 420 S Page St Unit 38, Lagrange, GA 30241 and is currently estimated at $217,714, approximately $158 per square foot. 420 S Page St Unit 38 is a home located in Troup County with nearby schools including Franklin Forest Elementary School, Hollis Hand Elementary School, and Hillcrest Elementary School.
Ownership History
Date
Name
Owned For
Owner Type
Purchase Details
Closed on
Feb 6, 2015
Sold by
Affordable Housing Assista
Bought by
Taylor Amber M
Current Estimated Value
Home Financials for this Owner
Home Financials are based on the most recent Mortgage that was taken out on this home.
Original Mortgage
$80,000
Outstanding Balance
$61,387
Interest Rate
3.81%
Mortgage Type
New Conventional
Estimated Equity
$156,327
Purchase Details
Closed on
Mar 14, 2014
Sold by
Sec Of Housing & U
Bought by
Affordable Housing Assistance
Home Financials for this Owner
Home Financials are based on the most recent Mortgage that was taken out on this home.
Original Mortgage
$70,000
Interest Rate
4.3%
Mortgage Type
New Conventional
Purchase Details
Closed on
Aug 7, 2012
Sold by
Branch Banking & Trust C
Bought by
Sec Of Housing & Urban
Purchase Details
Closed on
Jun 19, 2009
Sold by
Dri Dixie
Bought by
Ligon Lakisa D
Home Financials for this Owner
Home Financials are based on the most recent Mortgage that was taken out on this home.
Original Mortgage
$125,345
Interest Rate
4.79%
Mortgage Type
FHA
Create a Home Valuation Report for This Property
The Home Valuation Report is an in-depth analysis detailing your home's value as well as a comparison with similar homes in the area
Home Values in the Area
Average Home Value in this Area
Purchase History
| Date | Buyer | Sale Price | Title Company |
|---|---|---|---|
| Taylor Amber M | $95,000 | -- | |
| Affordable Housing Assistance | $73,000 | -- | |
| Sec Of Housing & Urban | $144,753 | -- | |
| Branch Banking & Trust Co | $144,753 | -- | |
| Ligon Lakisa D | $127,659 | -- | |
| Ligon Lakisa D | $127,659 | -- |
Source: Public Records
Mortgage History
| Date | Status | Borrower | Loan Amount |
|---|---|---|---|
| Open | Taylor Amber M | $80,000 | |
| Previous Owner | Affordable Housing Assistance | $70,000 | |
| Previous Owner | Ligon Lakisa D | $125,345 |
Source: Public Records
Tax History Compared to Growth
Tax History
| Year | Tax Paid | Tax Assessment Tax Assessment Total Assessment is a certain percentage of the fair market value that is determined by local assessors to be the total taxable value of land and additions on the property. | Land | Improvement |
|---|---|---|---|---|
| 2024 | $1,849 | $67,800 | $10,000 | $57,800 |
| 2023 | $1,841 | $67,520 | $10,000 | $57,520 |
| 2022 | $1,633 | $58,520 | $8,000 | $50,520 |
| 2021 | $1,467 | $48,640 | $8,000 | $40,640 |
| 2020 | $1,467 | $48,640 | $8,000 | $40,640 |
| 2019 | $1,425 | $47,240 | $8,000 | $39,240 |
| 2018 | $1,425 | $47,240 | $8,000 | $39,240 |
| 2017 | $1,425 | $47,240 | $8,000 | $39,240 |
| 2016 | $1,452 | $38,000 | $6,313 | $31,687 |
| 2015 | $1,405 | $46,519 | $8,000 | $38,519 |
| 2014 | $1,346 | $44,492 | $8,000 | $36,492 |
| 2013 | -- | $46,889 | $8,000 | $38,889 |
Source: Public Records
Map
Nearby Homes
- 400 S Page St
- 134 S Page St
- 114 Briarcliff Rd
- 129 Celebration Blvd
- 517 Tradition Place
- 519 Tradition Place
- 117 Celebration Blvd
- 806 New Franklin Rd
- 112 Celebration Blvd
- 793 Celebration Blvd
- 200 Crestwood Dr
- 89 Chase Rd
- 210 Hearthstone Dr
- 204 Colonial St
- 121 Ct
- 114 Crestwood Dr
- 109 Dogwood Dr
- 110 Russell St
- 900 North St
- 105 Lenox Cir
- 420 S Page St
- 410 S Page St
- 430 S Page St
- 440 S Page St
- 217 Cosby Dr
- 215 Cosby Dr
- 431 S Page St
- 450 S Page St
- 433 S Page St
- 433 S Page St Unit 55B
- 221 Cosby Dr
- 441 S Page St
- 300 S Page St
- 103 Cold Water Terrace
- 460 S Page St
- 451 S Page St
- 123 Cold Water Terrace
- 123 Cold Water Terrace Unit 52B
- 213 Cosby Dr
- 101 Cold Water Terrace