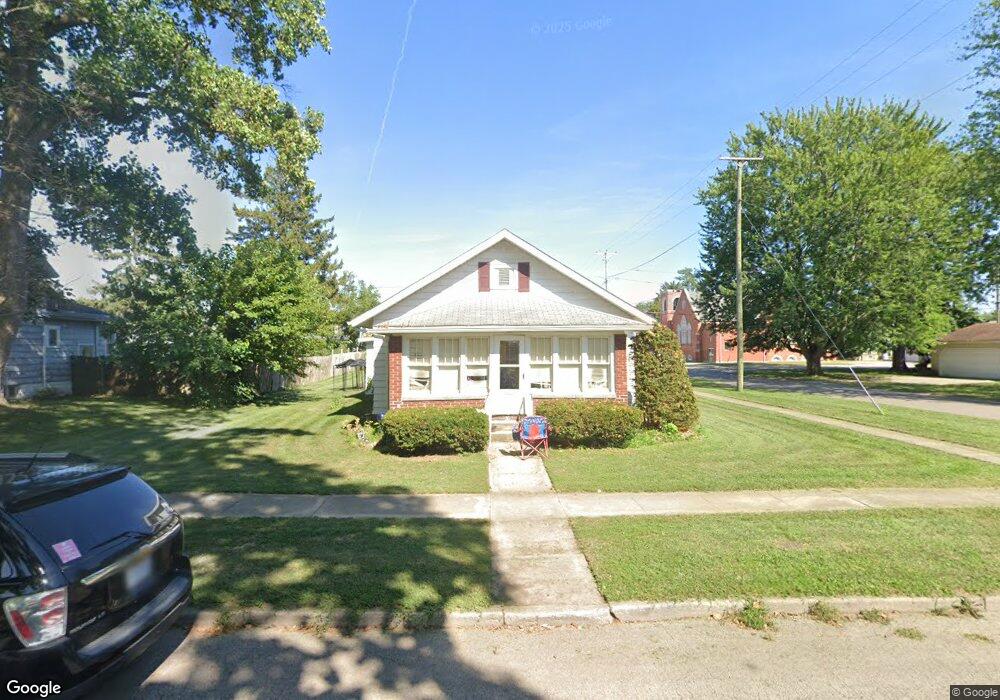
420 S Tyler St van Wert, OH 45891
Estimated Value: $100,941 - $148,000
1
Bed
1
Bath
937
Sq Ft
$131/Sq Ft
Est. Value
About This Home
This home is located at 420 S Tyler St, van Wert, OH 45891 and is currently estimated at $122,985, approximately $131 per square foot. 420 S Tyler St is a home located in Van Wert County with nearby schools including Van Wert Early Childhood Center, Van Wert High School, and Lifelinks Community School.
Ownership History
Date
Name
Owned For
Owner Type
Purchase Details
Closed on
Dec 4, 2019
Sold by
Keller Kathleen Marie and Keller Kathleen
Bought by
Keller Jeffery A and Keller Jeff
Current Estimated Value
Purchase Details
Closed on
Nov 13, 2011
Bought by
Keller Jeffrey A and Keller Kathleen
Purchase Details
Closed on
Nov 2, 2009
Sold by
Hoverman Richard and Hoverman Mike
Bought by
Keller Jeffery A and Keller Kathleen
Home Financials for this Owner
Home Financials are based on the most recent Mortgage that was taken out on this home.
Original Mortgage
$30,000
Interest Rate
4.96%
Mortgage Type
New Conventional
Purchase Details
Closed on
Nov 2, 1998
Bought by
Spry Donald W and Spry Virginia
Purchase Details
Closed on
Apr 8, 1996
Bought by
Reidenbach David F
Purchase Details
Closed on
Mar 7, 1994
Bought by
Reidenbach Mary R
Create a Home Valuation Report for This Property
The Home Valuation Report is an in-depth analysis detailing your home's value as well as a comparison with similar homes in the area
Home Values in the Area
Average Home Value in this Area
Purchase History
| Date | Buyer | Sale Price | Title Company |
|---|---|---|---|
| Keller Jeffery A | -- | None Available | |
| Keller Jeffrey A | $39,000 | -- | |
| Keller Jeffery A | $39,000 | Attorney | |
| Spry Donald W | $44,000 | -- | |
| Reidenbach David F | $41,600 | -- | |
| Reidenbach Mary R | $38,500 | -- |
Source: Public Records
Mortgage History
| Date | Status | Borrower | Loan Amount |
|---|---|---|---|
| Previous Owner | Keller Jeffery A | $30,000 |
Source: Public Records
Tax History Compared to Growth
Tax History
| Year | Tax Paid | Tax Assessment Tax Assessment Total Assessment is a certain percentage of the fair market value that is determined by local assessors to be the total taxable value of land and additions on the property. | Land | Improvement |
|---|---|---|---|---|
| 2024 | $751 | $21,620 | $4,420 | $17,200 |
| 2023 | $751 | $21,620 | $4,420 | $17,200 |
| 2022 | $725 | $18,220 | $2,950 | $15,270 |
| 2021 | $707 | $18,220 | $2,950 | $15,270 |
| 2020 | $705 | $18,220 | $2,950 | $15,270 |
| 2019 | $611 | $15,400 | $2,950 | $12,450 |
| 2018 | $206 | $15,400 | $2,950 | $12,450 |
| 2017 | $221 | $15,400 | $2,950 | $12,450 |
| 2016 | $190 | $16,150 | $2,950 | $13,200 |
| 2015 | $190 | $16,150 | $2,950 | $13,200 |
| 2014 | $184 | $16,150 | $2,950 | $13,200 |
| 2013 | $227 | $16,150 | $2,950 | $13,200 |
Source: Public Records
Map
Nearby Homes
- 515 S Race St
- 529 S Tyler St
- 222 S Harrison St
- 627 S Walnut St
- 914 E Crawford St
- 142 E Raymond St
- 1008 Maplewood Dr
- 919 E Sycamore St
- 202 N Jefferson St
- 214 N Jefferson St
- 409 N Cherry St
- 941 Elm St
- 1026 Elm St
- 517 N Walnut St
- 1057 Maxine Ln
- 1236 E Ervin Rd
- 623 N Cherry St
- 960 Glenn St
- 522 South Ave
- 228 W 2nd St
- 414 S Tyler St
- 502 S Tyler St
- 421 S Race St
- 408 S Tyler St
- 415 S Race St
- 421 S Tyler St
- 514 S Tyler St
- 415 S Tyler St
- 402 S Tyler St
- 520 Frothingham St
- 501 S Race St
- 409 S Tyler St
- 616 Greenewald St
- 509 S Race St
- 516 S Tyler St
- 509 S Tyler St
- 509 Frothingham St
- 403 S Tyler St
- 513 S Race St
- 701 Frothingham St