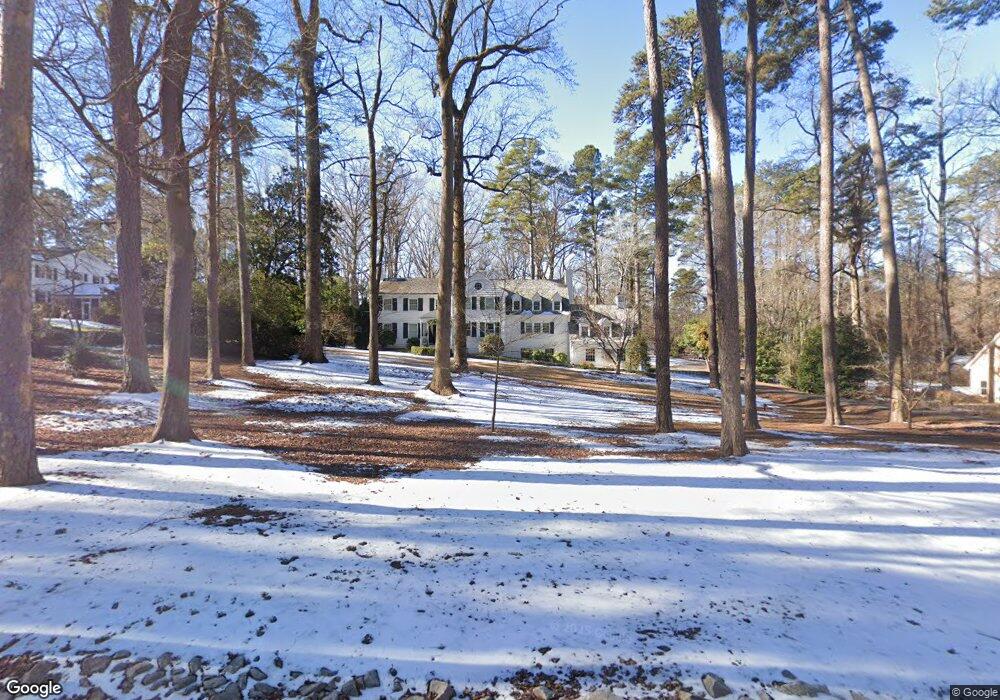
420 S Woodland Rd Henderson, NC 27536
Estimated Value: $599,000 - $792,000
5
Beds
6
Baths
5,273
Sq Ft
$134/Sq Ft
Est. Value
About This Home
This home is located at 420 S Woodland Rd, Henderson, NC 27536 and is currently estimated at $704,981, approximately $133 per square foot. 420 S Woodland Rd is a home located in Vance County with nearby schools including E.M. Rollins Elementary School, Vance County Middle School, and Vance County High School.
Ownership History
Date
Name
Owned For
Owner Type
Purchase Details
Closed on
Dec 4, 2020
Sold by
Kirby Cara W and Kirby Thomas D
Bought by
Falkner Joseph Coleman and Falkner Sara Gibson
Current Estimated Value
Home Financials for this Owner
Home Financials are based on the most recent Mortgage that was taken out on this home.
Original Mortgage
$380,000
Outstanding Balance
$338,146
Interest Rate
2.8%
Mortgage Type
New Conventional
Estimated Equity
$366,835
Purchase Details
Closed on
Dec 8, 2010
Sold by
Pendergraft Stephen D and Pendergraft Cameron C
Bought by
Kirby Cara W and Kirby Ii Thomas D
Home Financials for this Owner
Home Financials are based on the most recent Mortgage that was taken out on this home.
Original Mortgage
$346,800
Interest Rate
4.18%
Mortgage Type
New Conventional
Create a Home Valuation Report for This Property
The Home Valuation Report is an in-depth analysis detailing your home's value as well as a comparison with similar homes in the area
Home Values in the Area
Average Home Value in this Area
Purchase History
| Date | Buyer | Sale Price | Title Company |
|---|---|---|---|
| Falkner Joseph Coleman | $400,000 | None Available | |
| Kirby Cara W | $433,500 | -- |
Source: Public Records
Mortgage History
| Date | Status | Borrower | Loan Amount |
|---|---|---|---|
| Open | Falkner Joseph Coleman | $380,000 | |
| Previous Owner | Kirby Cara W | $346,800 |
Source: Public Records
Tax History Compared to Growth
Tax History
| Year | Tax Paid | Tax Assessment Tax Assessment Total Assessment is a certain percentage of the fair market value that is determined by local assessors to be the total taxable value of land and additions on the property. | Land | Improvement |
|---|---|---|---|---|
| 2025 | $8,230 | $593,149 | $63,450 | $529,699 |
| 2024 | $8,209 | $593,149 | $63,450 | $529,699 |
| 2023 | $5,256 | $313,175 | $44,982 | $268,193 |
| 2022 | $5,137 | $313,175 | $44,982 | $268,193 |
| 2021 | $5,017 | $313,175 | $44,982 | $268,193 |
| 2020 | $5,134 | $313,175 | $44,982 | $268,193 |
| 2019 | $5,129 | $313,175 | $44,982 | $268,193 |
| 2018 | $5,017 | $313,175 | $44,982 | $268,193 |
| 2017 | $5,122 | $313,175 | $44,982 | $268,193 |
| 2016 | $5,122 | $313,175 | $44,982 | $268,193 |
| 2015 | $5,671 | $420,540 | $123,379 | $297,161 |
| 2014 | $6,043 | $420,541 | $123,379 | $297,162 |
Source: Public Records
Map
Nearby Homes
- 3070 Cameron Dr
- 3203 Cameron Dr
- 415 Beechwood Trail
- 115 Red Bud Dr
- 106 Orchard Rd
- 2118 N Woodland Rd
- 105 Fernwood Creek Ct
- 2535 Fairway Dr Unit 3
- 105 Sunset Cir
- 00 Oxford Rd Southern Ave Rd
- 2315 Oxford Rd
- 1744 Parker Ln
- 3002 Sidney Hill
- Lot 5 Sidney Hill
- 159 Dorsey Place
- 409 Eagle Ct
- 404 Eagle Ct
- 407 Eagle Ct
- 307 Yowland Rd
- 1822 Ruin Creek Rd
- 418 S Woodland Rd
- 430 S Woodland Rd
- 325 S Woodland Rd
- 550 Deepwood Dr
- 535 Deepwood Dr
- 421 S Woodland Rd
- 2930 Dogwood Dr
- 425 S Woodland Rd
- 440 S Woodland Rd
- 525 Deepwood Dr
- 315 S Woodland Rd
- 2920 Dogwood Dr
- 548 S Woodland Rd
- 2910 Dogwood Dr
- 565 Deepwood Dr
- 555 Deepwood Dr
- 501 S Woodland Rd
- 109 Lattimore Wright Rd
- 444 S Woodland Rd
- 101 Pineview Dr