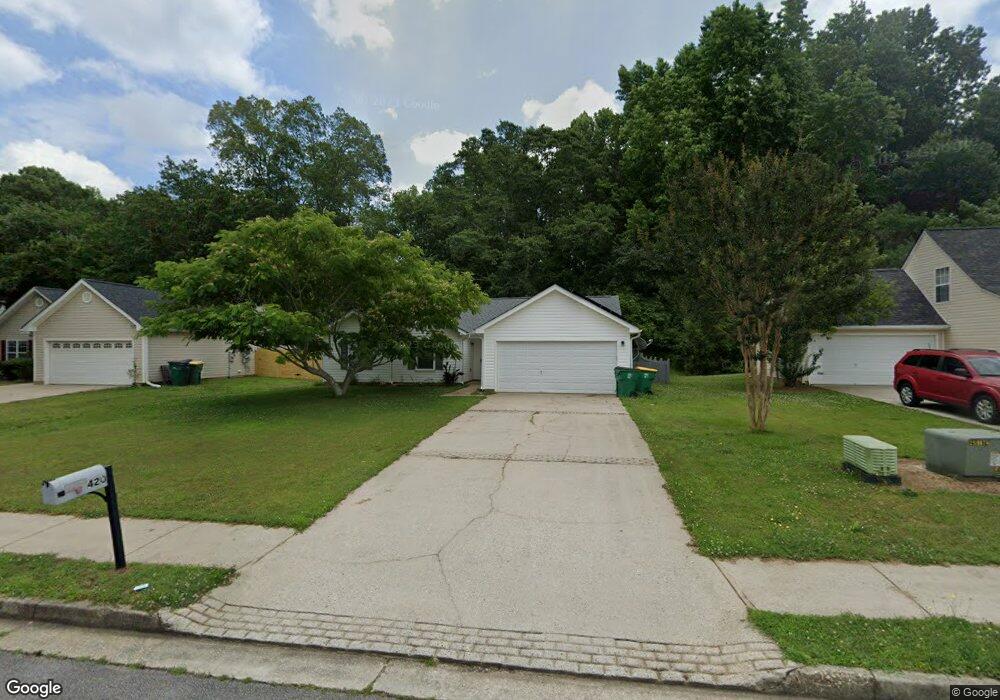
420 Shenandoah Ct Unit 25 Winder, GA 30680
Estimated Value: $291,000 - $308,079
3
Beds
2
Baths
1,243
Sq Ft
$241/Sq Ft
Est. Value
About This Home
This home is located at 420 Shenandoah Ct Unit 25, Winder, GA 30680 and is currently estimated at $300,020, approximately $241 per square foot. 420 Shenandoah Ct Unit 25 is a home located in Barrow County with nearby schools including County Line Elementary School, Russell Middle School, and Winder-Barrow High School.
Ownership History
Date
Name
Owned For
Owner Type
Purchase Details
Closed on
Jul 20, 2018
Sold by
Agent Robert A Robert A
Bought by
Hanson Sarah Elizabeth and Martinez Ruben C
Current Estimated Value
Home Financials for this Owner
Home Financials are based on the most recent Mortgage that was taken out on this home.
Original Mortgage
$117,928
Outstanding Balance
$101,905
Interest Rate
4.37%
Mortgage Type
FHA
Estimated Equity
$198,115
Purchase Details
Closed on
Apr 19, 2006
Sold by
Crowe Dana B
Bought by
Agent Robert R and Agent Robert R
Home Financials for this Owner
Home Financials are based on the most recent Mortgage that was taken out on this home.
Original Mortgage
$112,000
Interest Rate
6.88%
Mortgage Type
New Conventional
Purchase Details
Closed on
May 13, 2003
Sold by
Shenandoah Partners
Bought by
Wise Built Homes Inc
Purchase Details
Closed on
Jul 22, 2002
Bought by
Shenandoah Partners
Create a Home Valuation Report for This Property
The Home Valuation Report is an in-depth analysis detailing your home's value as well as a comparison with similar homes in the area
Home Values in the Area
Average Home Value in this Area
Purchase History
| Date | Buyer | Sale Price | Title Company |
|---|---|---|---|
| Hanson Sarah Elizabeth | $150,900 | -- | |
| Agent Robert R | $117,900 | -- | |
| Wise Built Homes Inc | $27,500 | -- | |
| Shenandoah Partners | -- | -- |
Source: Public Records
Mortgage History
| Date | Status | Borrower | Loan Amount |
|---|---|---|---|
| Open | Hanson Sarah Elizabeth | $117,928 | |
| Previous Owner | Agent Robert R | $112,000 |
Source: Public Records
Tax History Compared to Growth
Tax History
| Year | Tax Paid | Tax Assessment Tax Assessment Total Assessment is a certain percentage of the fair market value that is determined by local assessors to be the total taxable value of land and additions on the property. | Land | Improvement |
|---|---|---|---|---|
| 2024 | $2,886 | $101,938 | $23,200 | $78,738 |
| 2023 | $2,603 | $92,034 | $22,000 | $70,034 |
| 2022 | $2,503 | $76,318 | $16,000 | $60,318 |
| 2021 | $2,058 | $61,003 | $14,000 | $47,003 |
| 2020 | $1,833 | $55,674 | $12,000 | $43,674 |
| 2019 | $1,984 | $55,674 | $12,000 | $43,674 |
| 2018 | $1,630 | $45,079 | $10,000 | $35,079 |
| 2017 | $1,068 | $35,800 | $10,000 | $25,800 |
| 2016 | $1,013 | $33,754 | $10,000 | $23,754 |
| 2015 | $1,023 | $34,016 | $10,000 | $24,016 |
| 2014 | $876 | $30,354 | $6,076 | $24,278 |
| 2013 | -- | $29,170 | $6,076 | $23,094 |
Source: Public Records
Map
Nearby Homes
- 420 Shenandoah Ct
- 418 Shenandoah Ct
- 422 Shenandoah Ct
- 422 Shenandoah Ct Unit 3
- 0 Shenandoah Ct Unit 3223417
- 0 Shenandoah Ct Unit 3118273
- 0 Shenandoah Ct Unit 7144357
- 0 Shenandoah Ct Unit 7096238
- 0 Shenandoah Ct Unit 7021649
- 0 Shenandoah Ct Unit 7117394
- 0 Shenandoah Ct Unit 7124127
- 0 Shenandoah Ct Unit 7215388
- 0 Shenandoah Ct Unit 7418831
- 0 Shenandoah Ct Unit 8149913
- 416 Shenandoah Ct
- 424 Shenandoah Ct Unit 3
- 54 Saint Ives Cir
- 426 Shenandoah Ct
- 426 Shenandoah Ct Unit 28
- 414 Shenandoah Ct Unit 3