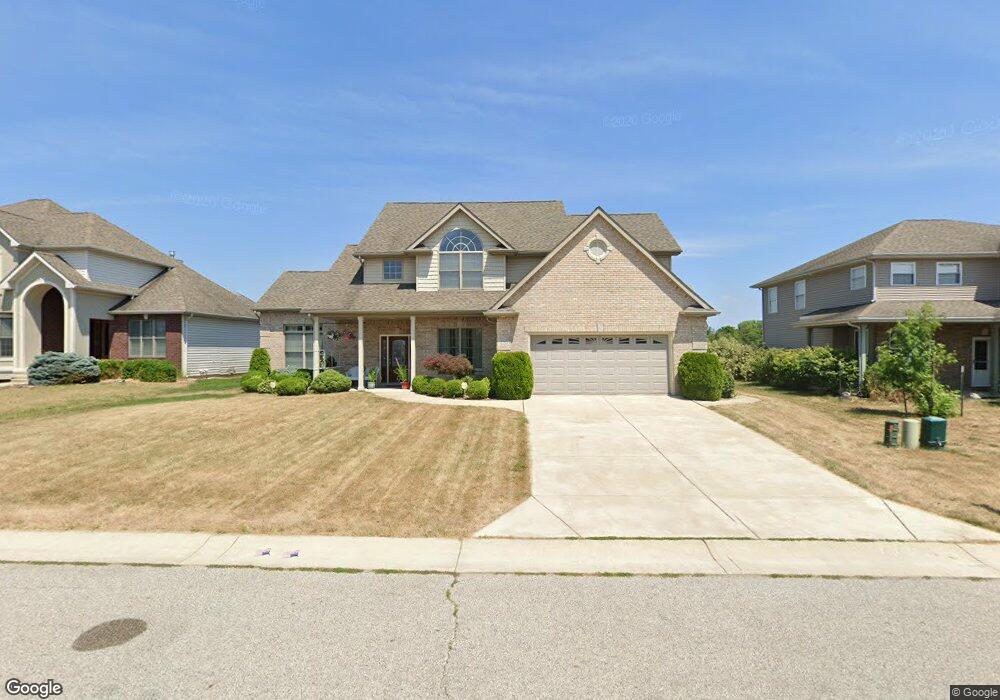
420 Sinclair Dr West Lafayette, IN 47906
Estimated Value: $400,081 - $420,000
Studio
1
Bath
2,419
Sq Ft
$170/Sq Ft
Est. Value
About This Home
This home is located at 420 Sinclair Dr, West Lafayette, IN 47906 and is currently estimated at $410,270, approximately $169 per square foot. 420 Sinclair Dr is a home located in Tippecanoe County with nearby schools including Burnett Creek Elementary School, Battle Ground Middle School, and William Henry Harrison High School.
Ownership History
Date
Name
Owned For
Owner Type
Purchase Details
Closed on
Aug 30, 2007
Sold by
Giles Casey B and Giles Amy L
Bought by
Calonia Hazel F
Current Estimated Value
Home Financials for this Owner
Home Financials are based on the most recent Mortgage that was taken out on this home.
Original Mortgage
$188,000
Outstanding Balance
$116,496
Interest Rate
6.79%
Mortgage Type
Purchase Money Mortgage
Estimated Equity
$293,774
Purchase Details
Closed on
Sep 12, 2005
Sold by
Krachinski Joshua L
Bought by
Giles Casey B and Giles Amy L
Home Financials for this Owner
Home Financials are based on the most recent Mortgage that was taken out on this home.
Original Mortgage
$184,800
Interest Rate
5.5%
Mortgage Type
Fannie Mae Freddie Mac
Purchase Details
Closed on
Oct 26, 2004
Sold by
Harrison Highlands I Llc
Bought by
Krachiaski Joshua L
Create a Home Valuation Report for This Property
The Home Valuation Report is an in-depth analysis detailing your home's value as well as a comparison with similar homes in the area
Purchase History
We collect this data history from publicly available records. To have your information removed, we recommend requesting removal directly through your county’s website.
| Date | Buyer | Sale Price | Title Company |
|---|---|---|---|
| Calonia Hazel F | -- | None Available | |
| Giles Casey B | -- | -- | |
| Krachiaski Joshua L | -- | -- |
Source: Public Records
Mortgage History
We collect this data history from publicly available records. To have your information removed, we recommend requesting removal directly through your county’s website.
| Date | Status | Borrower | Loan Amount |
|---|---|---|---|
| Open | Calonia Hazel F | $188,000 | |
| Previous Owner | Giles Casey B | $184,800 |
Source: Public Records
Tax History
| Year | Tax Paid | Tax Assessment Tax Assessment Total Assessment is a certain percentage of the fair market value that is determined by local assessors to be the total taxable value of land and additions on the property. | Land | Improvement |
|---|---|---|---|---|
| 2025 | $3,626 | $359,100 | $72,500 | $286,600 |
| 2024 | $3,626 | $380,500 | $72,500 | $308,000 |
| 2023 | $1,817 | $281,300 | $31,400 | $249,900 |
| 2022 | $1,722 | $243,200 | $31,400 | $211,800 |
| 2021 | $1,550 | $222,300 | $31,400 | $190,900 |
| 2020 | $1,398 | $213,100 | $31,400 | $181,700 |
| 2019 | $1,330 | $206,000 | $31,400 | $174,600 |
| 2018 | $1,253 | $200,000 | $31,400 | $168,600 |
| 2017 | $1,206 | $196,800 | $31,400 | $165,400 |
| 2016 | $1,164 | $193,300 | $31,400 | $161,900 |
| 2014 | $1,103 | $186,400 | $31,400 | $155,000 |
| 2013 | $1,159 | $186,400 | $31,400 | $155,000 |
Source: Public Records
Map
Nearby Homes
- 474 Sinclair Dr
- 366 Macbeth Dr
- 378 Buchanan Dr
- 310 Sinclair Dr
- 90 Chattan Dr
- 6375 Cherry Creek Ct
- 5800 N 50 W
- 6442 Shale Crescent Dr
- 6358 Shale Crescent Dr
- 5762 Augusta Blvd
- 5793 Galena St
- 5925 Rapallo (Lot 277) Dr
- 5810 Augusta Blvd
- 6519 Ironclad Way
- 5822 Galena St
- 5812 Galena St
- 5750 Augusta Blvd
- 5802 Galena St
- 6196 Shale Crescent Dr
- 5844 Rapallo Dr
- 6181 Buchanan Dr
- 6181 Buchannan Dr
- 6197 Buchanan Dr
- 6197 Buchannan Dr
- 6159 Buchannan Dr
- 6159 Buchanan Dr
- 6149 Buchannan Dr
- 401 Sinclair Dr
- 6184 Buchanan Dr
- 6184 Buchannan Dr
- 6184 Buchannan Dr
- 6142 Macbeth Dr
- 404 Macbeth Dr
- 483 Sinclair Dr
- 6168 Buchanan Dr
- 6133 Buchannan Dr
- 438 Sinclair Dr
- 456 Sinclair Dr
- 387 Sinclair Dr
- 6128 Macbeth Dr
Your Personal Tour Guide
Ask me questions while you tour the home.