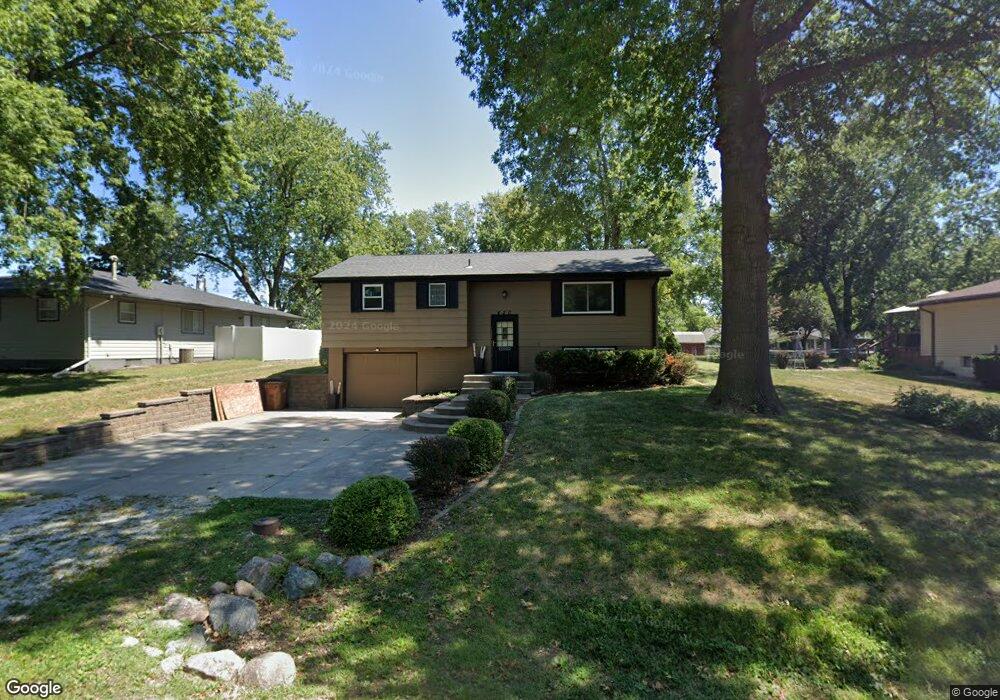
420 Van Buren St Bennet, NE 68317
Estimated Value: $224,252 - $236,000
3
Beds
2
Baths
1,346
Sq Ft
$170/Sq Ft
Est. Value
About This Home
This home is located at 420 Van Buren St, Bennet, NE 68317 and is currently estimated at $228,563, approximately $169 per square foot. 420 Van Buren St is a home located in Lancaster County with nearby schools including Elementary at Bennet and Junior/Senior High School at Palmyra.
Ownership History
Date
Name
Owned For
Owner Type
Purchase Details
Closed on
Jul 8, 2014
Sold by
Stall Matthew L and Stall Erika M
Bought by
Shrader Jenni
Current Estimated Value
Home Financials for this Owner
Home Financials are based on the most recent Mortgage that was taken out on this home.
Original Mortgage
$94,500
Outstanding Balance
$71,825
Interest Rate
4.18%
Mortgage Type
New Conventional
Estimated Equity
$156,738
Purchase Details
Closed on
Sep 9, 2009
Sold by
Meyers Richard L and Meyers Patricia Ann
Bought by
Stall Matthew L
Home Financials for this Owner
Home Financials are based on the most recent Mortgage that was taken out on this home.
Original Mortgage
$103,061
Interest Rate
5.2%
Mortgage Type
New Conventional
Create a Home Valuation Report for This Property
The Home Valuation Report is an in-depth analysis detailing your home's value as well as a comparison with similar homes in the area
Purchase History
| Date | Buyer | Sale Price | Title Company |
|---|---|---|---|
| Shrader Jenni | $126,000 | Nebraska Title Co | |
| Stall Matthew L | $101,000 | Ct |
Source: Public Records
Mortgage History
| Date | Status | Borrower | Loan Amount |
|---|---|---|---|
| Open | Shrader Jenni | $94,500 | |
| Previous Owner | Stall Matthew L | $103,061 |
Source: Public Records
Tax History
| Year | Tax Paid | Tax Assessment Tax Assessment Total Assessment is a certain percentage of the fair market value that is determined by local assessors to be the total taxable value of land and additions on the property. | Land | Improvement |
|---|---|---|---|---|
| 2025 | $2,560 | $221,400 | $70,000 | $151,400 |
| 2024 | $2,560 | $198,800 | $62,000 | $136,800 |
| 2023 | $3,473 | $198,800 | $62,000 | $136,800 |
| 2022 | $3,087 | $163,300 | $48,000 | $115,300 |
| 2021 | $2,911 | $163,300 | $48,000 | $115,300 |
| 2020 | $2,707 | $146,300 | $48,000 | $98,300 |
| 2019 | $2,723 | $146,300 | $48,000 | $98,300 |
| 2018 | $2,402 | $124,100 | $35,000 | $89,100 |
| 2017 | $2,324 | $124,100 | $35,000 | $89,100 |
| 2016 | $2,441 | $119,400 | $30,000 | $89,400 |
| 2015 | $2,391 | $119,400 | $30,000 | $89,400 |
| 2014 | $2,152 | $105,400 | $30,000 | $75,400 |
| 2013 | -- | $105,400 | $30,000 | $75,400 |
Source: Public Records
Map
Nearby Homes
- 1240 Hackberry St
- 400 Evergreen Rd
- 1240 Evergreen Rd
- 1140 Evergreen Rd
- 920 Evergreen Rd
- 1180 Evergreen Rd
- 1245 Evergreen Rd
- 405 Evergreen Rd
- 985 Evergreen Rd
- 1201 Evergreen Rd
- 1167 Evergreen Rd
- 1020 Evergreen Rd
- 1125 Evergreen Rd
- 945 Evergreen Rd
- 1005 Evergreen Rd
- 1100 Evergreen Rd
- 915 Evergreen Rd
- 940 Evergreen Rd
- 1040 Evergreen Rd
- 1220 Evergreen Rd
- 400 Van Buren St
- 460 Van Buren St
- 630 Elm St
- 425 Harrison Cir
- 575 Dogwood St
- 435 Van Buren St
- 435 Harrison Cir
- 580 Elm St
- 400 Harrison Cir
- 365 Van Buren St
- 350 Van Buren St
- 410 Jackson St
- 470 Jackson St
- 585 Elm St
- 335 Van Buren St
- 410 Harrison Cir
- 310 Van Buren St
- 420 Harrison Cir
- 430 Harrison Cir
- 510 Dogwood St
Your Personal Tour Guide
Ask me questions while you tour the home.