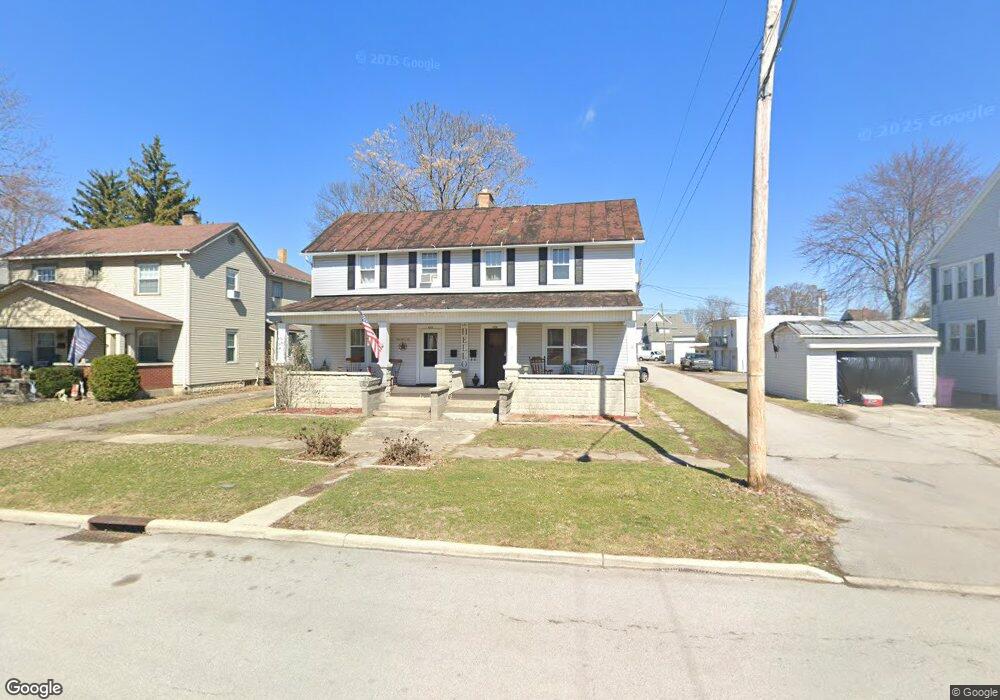
420 W Hardin St Findlay, OH 45840
Estimated Value: $159,851 - $196,000
3
Beds
2
Baths
2,240
Sq Ft
$80/Sq Ft
Est. Value
About This Home
This home is located at 420 W Hardin St, Findlay, OH 45840 and is currently estimated at $178,713, approximately $79 per square foot. 420 W Hardin St is a home located in Hancock County with nearby schools including Lincoln Elementary School, Donnell Middle School, and Findlay High School.
Ownership History
Date
Name
Owned For
Owner Type
Purchase Details
Closed on
Dec 30, 2021
Sold by
Roof Shannon
Bought by
Dib Fouad and Dib Carla
Current Estimated Value
Home Financials for this Owner
Home Financials are based on the most recent Mortgage that was taken out on this home.
Original Mortgage
$161,519
Outstanding Balance
$148,879
Interest Rate
3.12%
Mortgage Type
FHA
Estimated Equity
$29,834
Purchase Details
Closed on
Feb 27, 2019
Sold by
Geroski Holdings Llc
Bought by
Roof Shannon
Home Financials for this Owner
Home Financials are based on the most recent Mortgage that was taken out on this home.
Original Mortgage
$101,270
Interest Rate
4.4%
Mortgage Type
New Conventional
Purchase Details
Closed on
Nov 23, 2016
Sold by
Geroski V Steven P
Bought by
Geroski Holdings Llc
Home Financials for this Owner
Home Financials are based on the most recent Mortgage that was taken out on this home.
Original Mortgage
$735,000
Interest Rate
3.52%
Mortgage Type
New Conventional
Purchase Details
Closed on
Oct 27, 2016
Sold by
Geroski Holdings Llc
Bought by
Geroski V Steven P
Home Financials for this Owner
Home Financials are based on the most recent Mortgage that was taken out on this home.
Original Mortgage
$735,000
Interest Rate
3.52%
Mortgage Type
New Conventional
Purchase Details
Closed on
Apr 25, 2016
Sold by
Geroski Steven P and Geroski Steven P
Bought by
Geroski Holdings Llc
Purchase Details
Closed on
Mar 20, 2013
Sold by
Busching Terry A and Busching Jacqueline M
Bought by
Gferoski Steven P
Home Financials for this Owner
Home Financials are based on the most recent Mortgage that was taken out on this home.
Original Mortgage
$52,500
Interest Rate
3.5%
Mortgage Type
New Conventional
Purchase Details
Closed on
Aug 14, 2001
Sold by
Searfoss James P
Bought by
Busching Terry E and Busching Jacqueline M
Home Financials for this Owner
Home Financials are based on the most recent Mortgage that was taken out on this home.
Original Mortgage
$79,600
Interest Rate
7.15%
Mortgage Type
New Conventional
Purchase Details
Closed on
Jan 30, 1998
Sold by
Settlemire Jon
Bought by
Searfoss James and Searfoss Samantha
Home Financials for this Owner
Home Financials are based on the most recent Mortgage that was taken out on this home.
Original Mortgage
$84,150
Interest Rate
7.16%
Mortgage Type
New Conventional
Purchase Details
Closed on
Oct 24, 1995
Sold by
Thom Lillian
Bought by
Settlemire Jon
Home Financials for this Owner
Home Financials are based on the most recent Mortgage that was taken out on this home.
Original Mortgage
$79,150
Interest Rate
7.68%
Mortgage Type
FHA
Create a Home Valuation Report for This Property
The Home Valuation Report is an in-depth analysis detailing your home's value as well as a comparison with similar homes in the area
Home Values in the Area
Average Home Value in this Area
Purchase History
| Date | Buyer | Sale Price | Title Company |
|---|---|---|---|
| Dib Fouad | $164,500 | Flag City Title Agency Inc | |
| Roof Shannon | $106,600 | Whitman Title Security | |
| Geroski Holdings Llc | -- | Assured Title Agency | |
| Geroski V Steven P | -- | Assured Title Agency | |
| Geroski Holdings Llc | -- | None Available | |
| Gferoski Steven P | -- | Assured Title Agency Inc | |
| Busching Terry E | $99,500 | -- | |
| Searfoss James | $93,500 | -- | |
| Settlemire Jon | $57,000 | -- |
Source: Public Records
Mortgage History
| Date | Status | Borrower | Loan Amount |
|---|---|---|---|
| Open | Dib Fouad | $161,519 | |
| Previous Owner | Roof Shannon | $101,270 | |
| Previous Owner | Geroski Holdings Llc | $735,000 | |
| Previous Owner | Gferoski Steven P | $52,500 | |
| Previous Owner | Busching Terry E | $79,600 | |
| Previous Owner | Searfoss James | $84,150 | |
| Previous Owner | Settlemire Jon | $79,150 |
Source: Public Records
Tax History Compared to Growth
Tax History
| Year | Tax Paid | Tax Assessment Tax Assessment Total Assessment is a certain percentage of the fair market value that is determined by local assessors to be the total taxable value of land and additions on the property. | Land | Improvement |
|---|---|---|---|---|
| 2024 | $1,367 | $37,990 | $5,920 | $32,070 |
| 2023 | $1,370 | $37,990 | $5,920 | $32,070 |
| 2022 | $1,347 | $37,500 | $5,920 | $31,580 |
| 2021 | $1,175 | $28,130 | $5,920 | $22,210 |
| 2020 | $1,175 | $28,130 | $5,920 | $22,210 |
| 2019 | $1,137 | $28,130 | $5,920 | $22,210 |
| 2018 | $1,092 | $24,460 | $5,150 | $19,310 |
| 2017 | $546 | $24,460 | $5,150 | $19,310 |
| 2016 | $1,087 | $24,460 | $5,150 | $19,310 |
| 2015 | $934 | $20,770 | $4,740 | $16,030 |
| 2014 | $934 | $20,770 | $4,740 | $16,030 |
| 2012 | $1,103 | $24,330 | $4,740 | $19,590 |
Source: Public Records
Map
Nearby Homes
- 514 Liberty St
- 419 W Lincoln St
- 527 W Lincoln St
- 720 S West St
- 801 W Sandusky St
- 225 Lima Ave
- 905 S West St
- 412 Lima Ave
- 407 Washington St
- 416 1/2 Lima Ave
- 210 Western Ave
- 915 W Main Cross St
- 202 Hancock St
- 829 Maple Ave
- 1115 Liberty St
- 0 Canadian Way Unit 20253551
- 0 Canadian Way Unit 6135400
- 817 Park St
- 420 1st St
- 213 Cherry St
- 414 W Hardin St
- 424 W Hardin St
- 428 W Hardin St
- 415 W Hardin St
- 430 W Hardin St
- 520 Liberty St
- 516 Liberty St
- 419 W Hardin St
- 423 W Hardin St
- 504 W Hardin St
- 500 W Hardin St
- 427 W Hardin St
- 608 Liberty St
- 431 W Hardin St
- 501 W Hardin St
- 417 W Sandusky St
- 612 Liberty St
- 506 W Hardin St
- 427 W Sandusky St
- 614 Liberty St